Key Takeaways:
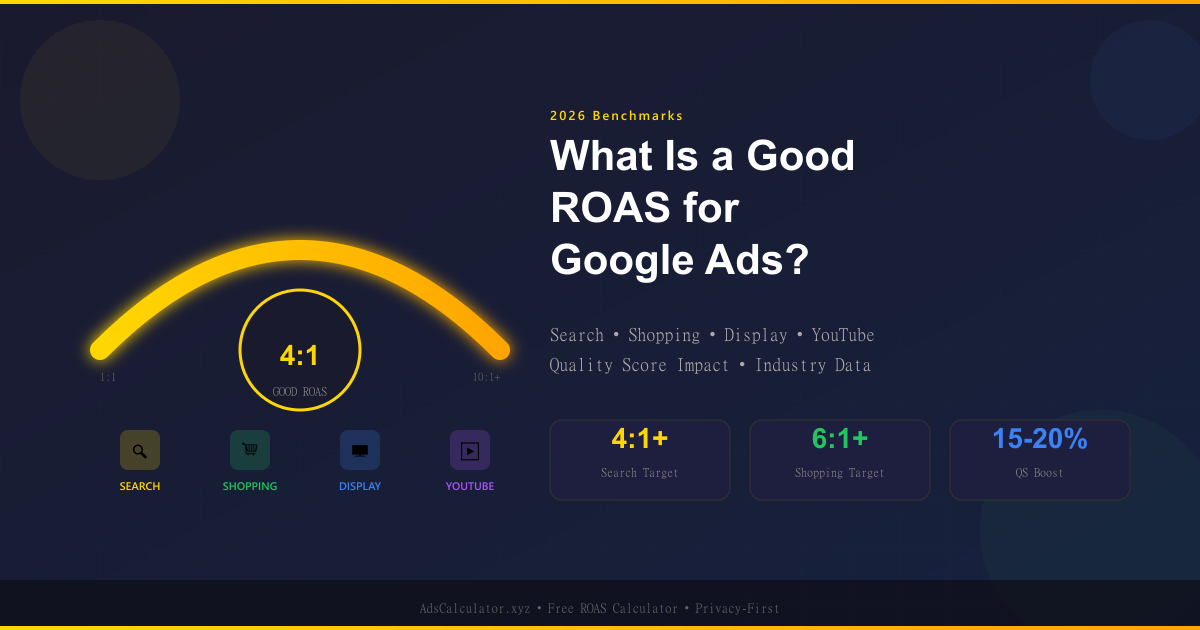
- A good ROAS for Google Search ads is 4:1 or higher — but Shopping and Display networks have very different benchmarks.Search averages 4.5:1 for top performers, while Shopping campaigns often hit 6:1+ for ecommerce.Quality Score is the hidden multiplier — a 1-point increase can drop CPC by 15-20%, directly boosting ROAS.
- Brand keywords routinely deliver 8:1+ while non-brand generic terms struggle at 2:1.
- Use our free ROAS calculator to find your break-even point and set realistic targets for each campaign type.
You just checked your Google Ads account. Your Search campaigns show a 3.2:1 ROAS. Your Shopping campaigns sit at 5.8:1. Display is dragging at 1.4:1. Is that good? Bad? Should you panic?
The answer depends entirely on which network you're looking at, what industry you're in, and whether you're bidding on brand terms or fighting for generic keywords. A 3:1 ROAS on brand Search terms is underperforming. The same number on non-brand Display might be a win.
In this guide, you'll learn exactly what constitutes a good ROAS for Google Ads in 2026, how benchmarks shift across Search, Shopping, Display, and YouTube, and how to calculate your own targets based on real margins — not industry averages.
What Is ROAS in Google Ads?
Google Ads ROAS (Return on Ad Spend) measures the revenue generated for every dollar spent across Google's advertising networks — Search, Shopping, Display, YouTube, and Performance Max. It's the north-star metric for evaluating whether your Google ad investment is paying off.
Google Ads ROAS Formula: ROAS = Conversion Value ÷ Ad Spend
For example, if you spend $2,000 on Google Search ads and generate $10,000 in attributed revenue, your ROAS is 5:1 (or 500%). Every dollar spent returned five dollars in revenue.
But here's what most advertisers miss: Google Ads ROAS is not a single number. It fractures by network, campaign type, keyword intent, and bidding strategy.
Google Ads ROAS vs. Blended ROAS
Google Ads ROAS specifically tracks performance within Google's ecosystem. This differs from:
- Blended ROAS — combines Google, Meta, TikTok, LinkedIn, and all other channels
- Platform ROAS — uses platform-attributed revenue (what Google reports)
- Incremental ROAS — measures only the additional revenue caused by ads (requires geo-experiments or holdout tests)
For this guide, we focus on platform-attributed ROAS within Google Ads — what you see in your dashboard.
What Is a Good ROAS for Google Ads in 2026?
The short answer: a good ROAS for Google Search ads is 4:1 or higher. For Shopping, it's 5:1+. For Display and YouTube, expectations drop to 2:1–3:1.
In 2026, Google reported that advertisers optimizing for conversion value (not just volume) see 18–22% higher ROAS on average [1]. Industry benchmarks from WebFX, Databox, and Shopify confirm that top quartile performers consistently clear 4:1 on Search, while the median across all industries sits closer to 2.5–3:1 [2] [3] [4].
Here's what "good" looks like by campaign type:
| Campaign Type | Average ROAS | Good ROAS Target | Top Quartile |
|---|---|---|---|
| Search (Brand) | 8.5:1 | 10:1+ | 15:1+ |
| Search (Non-Brand Generic) | 2.8:1 | 4:1+ | 6:1+ |
| Search (Non-Brand High-Intent) | 3.5:1 | 5:1+ | 7:1+ |
| Shopping (Standard) | 4.2:1 | 6:1+ | 8:1+ |
| Shopping (Performance Max) | 3.8:1 | 5:1+ | 7:1+ |
| Display (Remarketing) | 3.2:1 | 4:1+ | 6:1+ |
| Display (Prospecting) | 1.8:1 | 2.5:1+ | 3.5:1+ |
| YouTube (In-Stream) | 2.1:1 | 3:1+ | 4:1+ |
| YouTube (Shorts/Action) | 2.5:1 | 3.5:1+ | 5:1+ |
| Performance Max (All Inventory) | 3.5:1 | 5:1+ | 7:1+ |
If your Google Ads ROAS is below 2:1 on Search, something is fundamentally off — either your targeting, creative, or conversion tracking needs work.
Google Ads ROAS Benchmarks by Industry (2026 Data)
The table below synthesizes data from WebFX, Databox, Shopify, and Google Ads API metrics reference [2] [3] [4] [5]. All figures represent average Search campaign ROAS for each industry.
| Industry | Average Search ROAS | Good ROAS Target | Break-Even ROAS (30% margin) |
|---|---|---|---|
| Legal Services | 5.8:1 | 8:1+ | 3.3:1 |
| Real Estate | 4.9:1 | 7:1+ | 3.3:1 |
| Health & Medical | 4.5:1 | 6:1+ | 3.3:1 |
| Finance & Insurance | 4.2:1 | 6:1+ | 3.3:1 |
| Home Services | 4.1:1 | 5.5:1+ | 3.3:1 |
| B2B Technology | 3.8:1 | 5:1+ | 3.3:1 |
| Ecommerce (Fashion & Apparel) | 3.5:1 | 5:1+ | 3.3:1 |
| Ecommerce (Electronics) | 3.2:1 | 4.5:1+ | 3.3:1 |
| Ecommerce (Health & Beauty) | 3.8:1 | 5.5:1+ | 3.3:1 |
| Travel & Hospitality | 3.6:1 | 5:1+ | 3.3:1 |
| Education & Courses | 4.0:1 | 6:1+ | 3.3:1 |
| Automotive (Parts/Accessories) | 3.4:1 | 5:1+ | 3.3:1 |
| Food & Beverage (DTC) | 3.1:1 | 4.5:1+ | 3.3:1 |
| Industrial & Manufacturing | 3.0:1 | 4.5:1+ | 3.3:1 |
Key Takeaways from the Data
- High-margin services (Legal, Real Estate, Finance) lead — they can afford higher CPCs and still hit strong ROAS because customer lifetime value is high.
- Ecommerce clusters around 3.5:1 — thin margins mean you need volume, not just efficiency.
- B2B Tech at 3.8:1 — longer sales cycles depress immediate ROAS; LTV:CAC ratio matters more than first-touch ROAS.
- Industrial/Manufacturing trails at 3.0:1 — niche keywords, low search volume, and complex buying journeys.
What Factors Affect Your Google Ads ROAS?
1. Quality Score: The Hidden ROAS Multiplier
This is the single biggest lever unique to Google Ads. Quality Score (1–10) directly determines your CPC and ad rank:
Actual CPC = (Ad Rank of Advertiser Below ÷ Your Quality Score) + $0.01
A 1-point Quality Score improvement typically reduces CPC by 15–20% [1]. Since ROAS = Revenue ÷ Spend, and Spend = Clicks × CPC, every CPC reduction directly lifts ROAS.
Quality Score components:
- Expected CTR — will users click? (most weight)
- Ad Relevance — does ad match keyword?
- Landing Page Experience — speed, relevance, transparency
2. Keyword Intent Dictates ROAS Ceiling
Not all keywords are created equal:
| Intent Type | Example | Typical ROAS Range | Strategy |
|---|---|---|---|
| Brand | "Nike running shoes" | 8:1–20:1+ | Protect aggressively, bid to top |
| High-Intent Non-Brand | "buy running shoes online" | 4:1–7:1 | Maximize impression share |
| Category/Generic | "running shoes" | 2:1–4:1 | Use for volume, watch margins |
| Informational | "best running shoes 2026" | 1.5:1–3:1 | Funnel to content/email capture |
3. Campaign Type & Network
As shown in the benchmarks table, Shopping campaigns outperform Search for ecommerce because product images + prices in SERP drive higher intent clicks. Performance Max blends all inventory but often underperforms pure Search on ROAS because it forces Display/YouTube spend.
4. Conversion Tracking Accuracy
If you're missing 30% of conversions (no Enhanced Conversions, no offline import, no CAPI), your reported ROAS is artificially low. Fix tracking before optimizing bids.
5. Attribution Model
Google's Data-Driven Attribution (DDA) typically credits more touchpoints than Last Click, inflating reported ROAS by 10–25% compared to legacy models. Be consistent in how you measure.
How to Improve Your Google Ads ROAS (Actionable Strategies)
1. Segment by Keyword Intent — Then Bid Accordingly
Don't treat all keywords the same. Structure campaigns by intent tier:
- Brand campaign — target ROAS 10:1+, max impression share
- High-Intent Non-Brand — target ROAS 5:1+, aggressive bidding
- Generic/Category — target ROAS 3:1, volume-focused
- Competitor Terms — target ROAS 3:1, conquest strategy
2. Improve Quality Score Systematically
Expected CTR: Test 3–5 ad variations per ad group. Use Responsive Search Ads (RSAs) with 10+ headlines and 4+ descriptions. Pin your best-performing headlines to position 1.
Ad Relevance: Match keyword → ad headline → landing page H1. Use Dynamic Keyword Insertion (DKI) sparingly — Google prefers explicit relevance.
Landing Page: Sub-3-second load time. Clear value proposition above fold. Match ad promise exactly. Remove navigation leaks.
3. Use Target ROAS (tROAS) Bidding — With Guardrails
tROAS is Google's value-based bidding. It works if you have:
- 50+ conversions in 30 days (per campaign)
- Accurate conversion values (not just $1 per lead)
- Realistic targets (don't set 10:1 if history is 3:1)
Pro tip: Start with Maximize Conversion Value (no target) for 2–3 weeks to build data, then layer on a conservative tROAS (e.g., 80% of current ROAS), then gradually increase.
4. Leverage Shopping & Performance Max for Ecommerce
If you sell physical products and aren't on Shopping, you're leaving money on the table. Shopping campaigns routinely hit 5:1–8:1 ROAS for the same products that do 3:1 on Search text ads.
Performance Max simplifies management but gives less control. Use it when:
- You have strong creative assets (images, video, text)
- Conversion tracking is rock-solid
- You're comfortable with Google allocating budget across networks
5. Build Robust Remarketing Audiences
Remarketing on Display and YouTube typically delivers 3:1–6:1 ROAS at a fraction of Search CPCs. Segment by:
- 1-day / 7-day / 30-day site visitors
- Cart abandoners (highest intent)
- Past purchasers (cross-sell/upsell)
- YouTube video viewers (engaged but not converted)
Learn more about retargeting strategies.
6. Optimize for Profit, Not Just ROAS
High ROAS on low-margin products can still lose money. Use Profit-Based Bidding:
- Calculate contribution margin per product (Revenue − COGS − Variable Costs)
- Set conversion values = contribution margin, not revenue
- Use tROAS on margin values
This shifts spend toward profitable products automatically.
7. Audit Search Terms Weekly
Negative keywords are the highest-ROI activity in Google Ads. Every week:
- Sort search terms by spend (high to low)
- Add irrelevant terms as negatives
- Identify new high-intent terms to add as exact match keywords
- Spot intent mismatches (e.g., "free" "jobs" "DIY" on commercial campaigns)
Common Mistakes That Kill Google Ads ROAS
Mistake 1: Chasing High ROAS on Brand Terms Only
Brand ROAS of 15:1 feels great. But if 80% of your spend is on brand, you're harvesting demand, not creating it. Total revenue plateaus. Fix: Cap brand at 20–30% of budget, reinvest in non-brand.
Mistake 2: Using Maximize Clicks or Target CPA for Ecommerce
These strategies optimize for volume or cost per acquisition, not revenue per dollar. For ecommerce, Maximize Conversion Value or tROAS is almost always superior.
Mistake 3: Ignoring Mobile vs. Desktop Performance
Mobile CTR is often higher but conversion rate lower. If mobile ROAS lags 30%+ behind desktop, consider bid adjustments or mobile-specific landing pages.
Mistake 4: Setting Unrealistic tROAS Targets
If your historical ROAS is 3:1, setting tROAS to 8:1 will strangle volume. Google will stop showing ads for queries it can't confidently hit that target. Ramp targets gradually: 3:1 → 3.5:1 → 4:1.
Mistake 5: Not Accounting for Lifetime Value
For subscription/SaaS, first-purchase ROAS of 2:1 might be fantastic if LTV is 10x first payment. Use LTV:CAC, not ROAS, for strategic decisions. ROAS is a tactical campaign metric.
Conclusion
A good ROAS for Google Ads in 2026 is 4:1+ on Search, 5:1+ on Shopping, 2.5:1+ on Display/YouTube — but your real target depends on margins, business model, and keyword intent.
The advertisers who win don't chase industry benchmarks. They:
- Calculate break-even ROAS from actual margins
- Segment by intent (brand vs. non-brand vs. generic)
- Obsess over Quality Score — it's the only "free" ROAS boost
- Use value-based bidding (tROAS) with accurate conversion values
- Track profit, not just revenue — especially for multi-product catalogs
Start with your break-even number, then work backward to campaign-level targets.
Take Action
Ready to find your numbers? Use our free calculators:
FAQ
1. Is a 2:1 ROAS good for Google Ads?
A 2:1 ROAS can be profitable if your profit margins exceed 50% (SaaS, digital products, high-margin services). For typical ecommerce with 20–30% margins, 2:1 is below break-even. Calculate your specific break-even: 1 ÷ profit margin.
2. What is the average ROAS for Google Search ads in 2026?
The cross-industry average for Google Search is approximately 3.1:1. Top performers achieve 5:1–8:1. Shopping campaigns average higher at 4.2:1.
3. How does Quality Score affect ROAS?
Quality Score directly impacts CPC. A 1-point increase typically reduces CPC by 15–20%. Since ROAS = Revenue ÷ (Clicks × CPC), every CPC reduction lifts ROAS proportionally. A Quality Score of 8 vs. 5 can mean 30–40% better ROAS for the same keywords.
4. Should I use Target ROAS or Maximize Conversion Value?
Start with Maximize Conversion Value (no target) to let Google gather data. Once you have 50+ conversions in 30 days and stable performance, add a conservative tROAS target (80% of current ROAS), then gradually increase.
5. Why is my Shopping ROAS higher than Search?
Shopping ads show product images, prices, and ratings directly in SERPs. Users click with higher purchase intent because they've already "pre-qualified" the product visually. This drives higher conversion rates at similar or lower CPCs.
6. How do I calculate ROAS for Performance Max?
Performance Max blends all networks. View ROAS at the campaign level in Google Ads, but also segment by channel (Insights → Channel breakdown) to see Search vs. Shopping vs. Display vs. YouTube performance. Set tROAS at the campaign level based on blended goals.
Related Articles
- What Is a Good ROAS for Meta Ads? 2026 Benchmarks by Industry — Compare platform benchmarks side by side.
- Break-Even ROAS: The Most Important Number Most Marketers Ignore — Calculate your exact profitability threshold.
- ROAS vs ROI: The Complete Guide for Marketers — Understand the difference between these two critical metrics.
- Google Ads vs Facebook Ads: Which Platform Wins for Your Business? — Platform comparison for budget allocation.
- CPM Benchmarks 2025: A Deep Dive for Marketers — Understand impression costs that feed into ROAS.
Related Calculators
- ROAS Calculator — Calculate your return on ad spend
- ROI & LTV Calculator — Factor in customer lifetime value
- CPA Calculator — Calculate cost per acquisition
- Marketing Mix Optimizer — Optimize channel-level ROAS