Key Takeaways:
- MER = Total Revenue ÷ Total Marketing Spend — measures overall channel efficiency.
- A good MER is 3:1–5:1 for ecommerce, higher for SaaS (5:1–10:1).
- MER avoids platform attribution disputes — single source of truth.
- Track MER weekly or monthly — not daily (budget cycling creates noise).
- Use MER alongside ROAS — ROAS for tactics, MER for strategy.
Your Meta ads show a 6:1 ROAS. Your Google Ads show 4:1. Your TikTok campaigns show 2:1. But when you look at your overall revenue versus total marketing spend, you're barely breaking even.
What happened?
The answer lies in how different attribution models count conversions differently — and why you need a metric that cuts through the noise. That metric is Marketing Efficiency Ratio (MER).
MER tells you how efficiently your total marketing investment generates revenue — across all channels, platforms, and campaigns. It's the single number that helps you make smarter budget decisions without arguing about attribution windows.
In this guide, you'll learn exactly how to calculate MER, what benchmarks to target, and how to use it to optimize your marketing budget allocation.
👉 Calculate your MER and other metrics — Free calculators for marketing efficiency.
1. What Is Marketing Efficiency Ratio (MER)?
Marketing Efficiency Ratio (MER) measures how much revenue your business generates for every dollar spent on marketing across all channels. It's sometimes called blended ROAS or overall ROAS, but MER is becoming the preferred term because it emphasizes the strategic rather than tactical view of marketing efficiency.
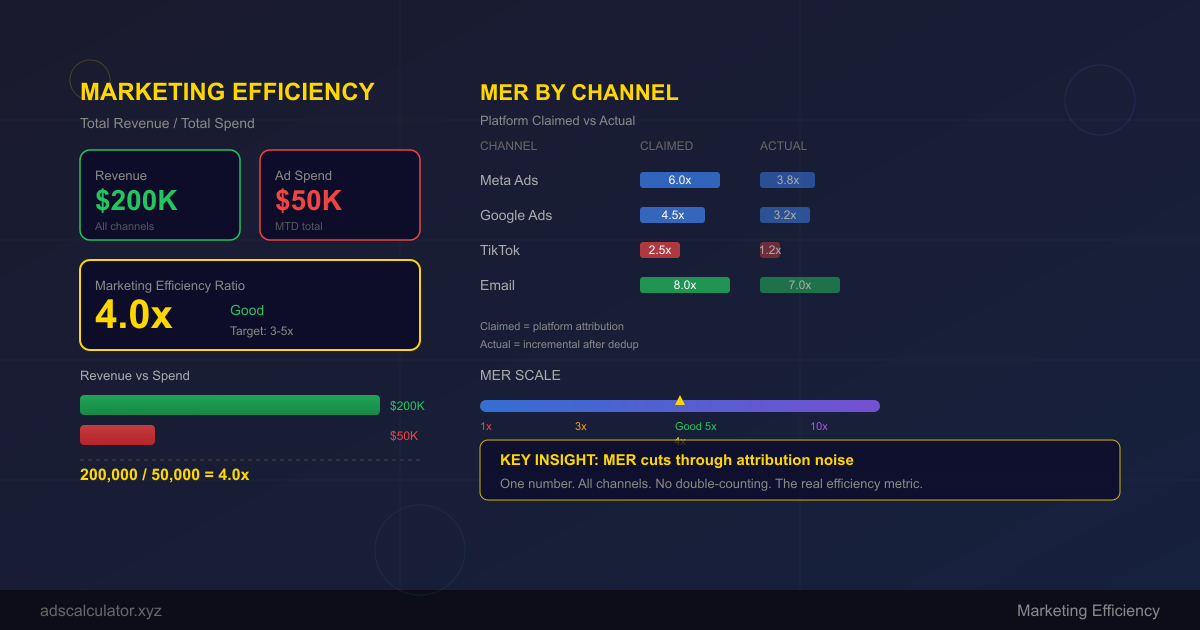
MER Formula: MER = Total Revenue from Marketing ÷ Total Marketing Spend
For example:
- $50,000 total marketing spend (Meta + Google + TikTok + Email + etc.)
- $200,000 total attributed revenue
- MER = $200,000 � $50,000 = 4:1 (or 4x)
Why MER Matters More Than Platform ROAS
The problem with platform-reported ROAS (Meta ROAS, Google ROAS) is double-counting. The same customer might be attributed to both a Meta ad and a Google search. Studies show that attribution overlap can be 20–40% — meaning you're counting the same sale twice.
MER solves this by looking at the actual business outcome: total revenue versus total spend.
MER vs. ROAS vs. ROI: What's the Difference?
| Metric | Scope | Formula | Best For |
|---|---|---|---|
| MER | All channels | Total Revenue ÷ Total Spend | Strategic budget decisions |
| ROAS | Single platform | Platform Revenue ÷ Platform Spend | Tactical campaign optimization |
| ROI | All-in | (Revenue – All Costs) ÷ All Costs | Profitability analysis |
MER is the middle ground — broader than platform ROAS (which is too narrow) but simpler than ROI (which includes product costs, overhead, etc.).
2. How to Calculate MER: Step-by-Step
Step 1: Define "Total Revenue"
You have two options:
A. Total company revenue (simpler)
- Use if marketing is the primary growth driver
- Includes all revenue: ecommerce sales, subscription renewals, etc.
- Best for DTC brands, single-product companies
B. Attributed revenue only (more precise)
- Revenue from channels you're actively marketing
- Excludes organic revenue not influenced by paid ads
For most companies, total company revenue is the right approach because it captures the full impact of marketing — including cross-channel synergies.
Step 2: Define "Total Marketing Spend"
Include:
- Ad spend (Meta, Google, Tik etc.)
- Agency and freelancer fees
- Marketing software/tools (Klaviyo, Shopify apps, etc.)
- Creative production costs
- Marketing team salaries (if you want the most accurate picture)
At minimum, include all ad spend + agency fees.
Step 3: Apply the Formula
Example:
| Item | Amount |
|---|---|
| Meta ad spend | $20,000 |
| Google ad spend | $15,000 |
| TikTok ad spend | $5,000 |
| Agency fees | $8,000 |
| Software/tools | $2,000 |
| Total Marketing Spend | $50,000 |
| Total Revenue | $200,000 |
| MER | 4:1 |
Step 4: Choose Your Timeframe
MER can be calculated daily, weekly, monthly, or quarterly. Each has tradeoffs:
| Timeframe | Pros | Cons |
|---|---|---|
| Daily | Quick feedback | High noise (budget cycling, time zones) |
| Weekly | Good balance | Still noisy for smaller budgets |
| Monthly | Stable, strategic | Slow feedback loop |
| Quarterly | Trend identification | Too slow for most decisions |
Recommendation: Track MER weekly for monitoring, monthly for decisions.
3. What Is a Good MER? Benchmarks by Industry
| Industry | Average MER | Good MER | Excellent MER |
|---|---|---|---|
| Ecommerce (DTC) | 2.5:1 | 4:1 | 6:1+ |
| SaaS / Subscription | 3.5:1 | 5:1 | 8:1+ |
| Fashion & Apparel | 2.8:1 | 4:1 | 5:1+ |
| Food & Beverage | 2.2:1 | 3.5:1 | 5:1+ |
| B2B Services | 3.0:1 | 5:1 | 7:1+ |
| Health & Beauty | 3.2:1 | 4.5:1 | 6:1+ |
| Travel & Hospitality | 2.5:1 | 4:1 | 5:1+ |
| High-Ticket (>$500) | 3.5:1 | 6:1 | 10:1+ |
Key Insights from the Benchmarks
- Higher margins → Higher MER target: If your gross margin is 70%, you need less revenue per dollar spent to be profitable.
- New accounts have lower MER: Brands under 18 months old typically have 20–30% lower MER than established brands.
- Seasonality matters: MER drops during Q4 (holiday competition) and rises in Q1 (less competition).
- High-ticket items have higher MER: A $2,000 product needs fewer sales to achieve a good MER.
The MER–Profitability Connection
MER alone doesn't tell you if you're profitable. You need to connect it to your margins:
Profit Check: Profit = Revenue – Marketing Spend – Product Costs – Overhead
If your MER is 4:1 but your product costs are 85% of revenue, you're losing money. Always compare MER to break-even requirements.
Calculate break-even ROAS and adjust your MER target.
4. MER vs. Platform ROAS: Why Numbers Don't Match
The Attribution Problem
Here's a common scenario:
- Meta reports: 6:1 ROAS ($120K revenue on $20K spend)
- Google reports: 4:1 ROAS ($60K revenue on $15K spend)
- Actual business revenue: $150K
- Total spend: $50K
MER = $150K ÷ $50K = 3:1
Why the gap? Because Meta and Google both claimed credit for the same conversions. The actual blended efficiency is lower than either platform reports.
Cross-Channel Cannibalization
When you run campaigns on multiple platforms, some conversions that would have happened anyway get attributed to paid channels. This is incrementality loss.
Studies by Nielsen and Incrementality show:
- 20–40% of attributed conversions would have occurred without the ad
- MER provides the ground truth that platform-reported numbers cannot.
When to Use Each Metric
| Scenario | Use | Why |
|---|---|---|
| Decreasing ad budget on one platform | Platform ROAS | Measures specific channel performance |
| Allocating budget across channels | MER | Avoids attribution overlaps |
| Reporting to leadership/stakeholders | MER | Single, trustworthy number |
| Campaign-level optimization | Platform ROAS | Granular enough for tactical decisions |
| Measuring incrementality | MER + test | Controls for organic revenue lift |
5. 6 Ways to Improve Your Marketing Efficiency Ratio
1. Reallocate Budget to Highest-Useful Channels
Don't judge channels by platform-reported ROAS. Instead, run incrementality tests to measure each channel's actual contribution to MER.
Method:
- Pause one geographic market (holdout) while running ads in others
- Compare MER in test vs. control markets
- The difference = true incrementality of that channel
2. Optimize Merchandising and Offers
How you bundle and present products dramatically affects MER:
- Increase AOV: Free shipping threshold at 1.3x average order value
- Bundle products: Higher perceived value, higher revenue per conversion
- Scarcity and urgency: Countdown timers (increases conversion 5–15%)
- Cross-sells on checkout: Add complementary items before purchase
3. Reduce Customer Acquisition Cost (CAC) Without Sacrificing Quality
Lower CAC means higher MER (same marketing spend, more customers):
- Lookalike audiences from your best customers
- Email marketing (cheapest channel: $0.01–$0.05 per send)
- SEO and organic content that generates traffic without paid spend
- Referral programs (referrals convert 3–5x better than cold traffic)
Read our full guide on reducing CAC.
4. Improve Landing Page Conversion Rates
A better landing page means more revenue from the same traffic = higher MER:
- Page load speed — every 1-second delay reduces conversions by 7%
- Social proof — reviews, trust badges, customer logos
- Clear value proposition — above the fold, within 3 seconds
- Mobile optimization — 60%+ of traffic is mobile
5. Diversify Across Channels
Relying on one platform is risky. You're vulnerable to:
- Algorithm changes (iOS 14.5 impact on Meta)
- Rising CPCs (Google CPCs increased 15–25% post-pandemic)
- Audience saturation (frequency fatigue)
A diversified channel mix smooths out fluctuations and gives you negotiation leverage with each platform.
6. Use MER to Set Budget Allocation
The ultimate use of MER: make budget decisions that improve overall efficiency:
- Calculate current MER
- Set a target improvement (e.g., from 3:1 to 4:1)
- Identify which channel(s) have the biggest gap between platform ROAS and incremental contribution
- Reallocate spend to incrementality-positive channels
- Measure MER 2–4 weeks later
- Repeat
6. Common MER Mistakes
Mistake 1: Trusting Platform-Reported Numbers at Face Value
Your analytics dashboard's total includes triple-counted conversions. Use platform data for tactical optimization, MER for strategic reporting.
Mistake 2: Using MER as Your Only Metric
MER tells you about marketing efficiency, but nothing about:
- Profit margins (a 4:1 MER can be unprofitable with 20% margins)
- Customer quality (cheap traffic may have high churn)
- Long-term brand equity (some marketing builds awareness that compounds)
Pair MER with: LTV:CAC ratio, churn rate, and net revenue retention.
Mistake 3: Ignoring Timing Delays
Marketing impact is not always immediate. View-through conversions, brand awareness effects, and word-of-mouth can take weeks or months. When measuring MER:
- Use rolling 30-day windows for ecommerce
- Use quarterly MER for B2B with long sales cycles
- Track MER alongside customer journey time to understand full impact
Mistake 4: Not Accounting for Organic Revenue Growth
If your business is growing organically (SEO, referrals, repeat purchases), your MER might look artificially high or low depending on your formula. Be consistent in how you define "marketing-influenced revenue."
7. Advanced Strategies for Understanding MER
Trend Over Time, Not Just Raw Numbers
The most valuable way to use MER is trend tracking — not setting a single metric target but tracking how efficiency changes week over week and month over month.
A declining MER trend might signal:
- Increased competition (higher CPCs across all platforms)
- Creative fatigue (same ads shown too many times)
- Market saturation in your core audience
- Seasonality (Q4 naturally has lower MER)
An improving MER trend suggests:
- Algorithm optimization (platforms learning your best audiences)
- Better landing page results gaining traction
- Positive incrementality from new channels
MER in a Multi-Product Business
If you sell multiple product lines or have multiple brands, calculate MER at each level for your most important segments:
- D2C vs. B2B segment
- Product line A vs. B
- Geography (US vs. EU campaigns)
- Seasonal products (holiday items vs. year-round staples)
This granular approach shows which products or segments deserve more investment.
MER and Profitability
As we've seen, marketing efficiency doesn't always equal business profitability. Connect MER to your true profit picture:
Profit Check: At your current MER, what is your actual profit after ALL costs (ad spend + product costs + overhead)?
Example for a brand with 4:1 MER, 40% gross margin:
- Revenue: $400,000 | Marketing Spend: $100,000
- Product Costs (60%): $240,000
- Gross Profit: $160,000
- After Marketing: $60,000
- After Operating Expenses: ~$30,000
This business is profitable — but with thin margins. If MER drops to 3:1, it's in trouble.
Beyond MER: Complementary Metrics
Don't rely on MER alone. Track it alongside:
- Customer Acquisition Cost (CAC): Are you paying more or less to acquire customers?
- LTV:CAC Ratio: Is the quality of acquired customers improving or declining?
- Blended ROAS: How does MER compare to what platforms claim?
- Customer Payback Period: How quickly do new customers recover their acquisition cost?
Master the LTV:CAC ratio for sustainable growth.
MER Budgeting: How to Forecast
Use historical MER to forecast future budget needs:
Formula: Target Revenue ÷ Target MER = Required Marketing Spend
| Target Revenue | Target MER | Required Marketing Spend |
|---|---|---|
| $500,000 | 4:1 | $125,000 |
| $1,000,000 | 4:1 | $250,000 |
| $500,000 | 5:1 | $100,000 |
| $1,000,000 | 5:1 | $200,000 |
Conclusion
Marketing Efficiency Ratio (MER) is the single most valuable metric for understanding how efficiently your total marketing investment drives revenue. It cuts through the attribution noise of platform-reported ROAS and gives you a clear, honest picture.
The key principles:
- MER = Total Revenue ÷ Total Marketing Spend
- A good MER is 3:1–5:1 for most industries
- Track MER weekly/monthly, not daily
- MER for strategy, platform ROAS for tactics
- Always connect MER to profitability margins
- Use MER trends to guide budget allocation decisions
Stop arguing about which platform gets credit. Start measuring marketing efficiency with a metric that reflects the real business outcome — total revenue versus total spend.
Take Action
- ROAS Calculator — Calculate return on ad spend
- Marketing Mix Optimizer — Optimize budget allocation
- Marketing Budget Planner — Set data-driven budget targets
- Break-Even ROAS Guide — Connect efficiency to profitability
- CAC Guide — Lower costs to boost MER
FAQ
1. What is a good Marketing Efficiency Ratio?
A good MER is 3:1–5:1 for most ecommerce businesses and 5:1–8:1 for SaaS/subscription businesses. Your specific target depends on profit margins — higher margins allow a lower target MER. Calculate your break-even MER by dividing 1 by your profit margin (as a decimal).
2. How is MER different from ROAS?
ROAS measures return on a single platform (e.g., Meta ROAS = Meta revenue ÷ Meta spend). MER measures total revenue divided by total marketing spend across all channels. MER avoids the double-counting that inflates platform-reported ROAS.
3. How often should you track MER?
Track MER weekly for monitoring trends, monthly for strategic decisions. Avoid daily tracking — budget cycling and timing fluctuations create noise that makes daily MER unreliable.
4. Can MER be too high?
Yes. An excessively high MER (e.g., 10:1+ for ecommerce) might mean you're underinvesting in growth. If competitors are spending more and growing faster, your "efficient" marketing may actually be limiting your market share.
5. How do you calculate MER for a new product launch?
For new products without historical data, use industry benchmarks as your initial target (4:1 for ecommerce, 6:1 for SaaS). Track weekly for the first 3 months, adjusting expectations as you gather real data. New launches typically start at 1–3:1 and improve as you optimize.
6. Should MER include organic revenue?
This depends on your business. If you use total company revenue in the MER formula, organic revenue is included (this is common). If you use marketing-attributed revenue only, organic is excluded. Whichever you choose, be consistent — the trend matters more than the absolute number.
Related Articles
- What Is a Good ROAS for Meta Ads? 2026 Benchmarks by Industry — Compare platform ROAS to the MER framework.
- ROAS vs ROI: The Complete Guide for Marketers — Understand the differences between these efficiency metrics.
- Customer Acquisition Cost (CAC): Complete Guide — Lower CAC to improve MER.
- Marketing Budget Planning: Complete Guide — Set budget targets using historical MER.
- Marketing KPIs Every Marketer Should Track in 2026 — See MER in the full marketing metrics framework.