Key Takeaways:
- Quality Score (QS) = 1-10 and directly determines your Ad Rank and CPC.
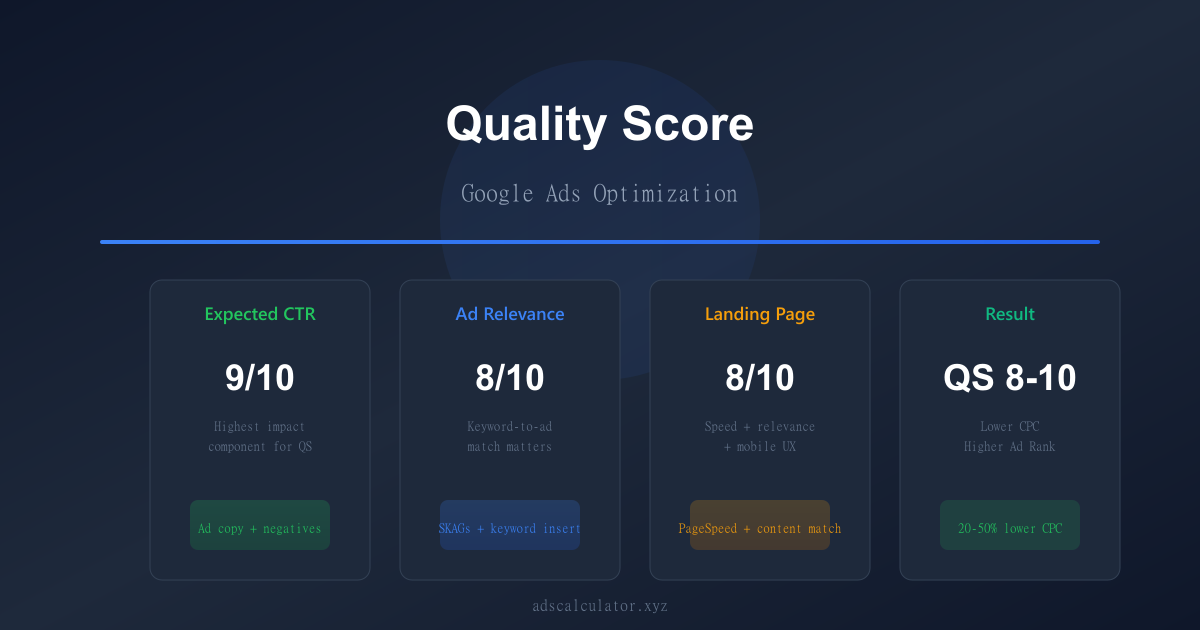
- QS has 3 components: Expected CTR, Ad Relevance, Landing Page Experience.
- Higher QS = lower CPC. A QS of 8 vs 4 can cut your cost per click by 50%.
- Expected CTR is the easiest win — better ad copy and negatives = big QS gains.
- Track QS weekly and pair it with [CPC](/cpc-calculator/) and [CTR](/ctr-calculator/) metrics.
Your Google Ads campaign has a brilliant offer, perfect targeting, and a generous budget. Yet your CPC is $6.50 while your competitor pays $2.80 for the same keyword. Why?
The answer is Quality Score (QS) — Google's hidden ranking metric that determines where your ad appears and how much you pay per click.
Many advertisers think Quality Score is just about keywords and ad copy. It's actually a sophisticated system with three components — and ignoring any one of them is costing you money every single day.
In this guide, you'll learn exactly what Quality Score is, how it's calculated, why it matters for your bottom line, and 10 proven tactics to improve it.
👉 Calculate how Quality Score affects your CPC — Free CPC calculator.
1. What Is Google Ads Quality Score?
Quality Score is Google's rating of the quality and relevance of your ads, keywords, and landing pages. It's measured on a scale of 1 to 10, where 10 is the highest possible score.
Important: Quality Score is a diagnostic metric, not a performance metric. Google doesn't use QS directly in ad auctions — they use the underlying components (expected CTR, ad relevance, landing page experience). But QS is the best proxy we have to predict auction performance.
Quality Score matters because it affects:
| Factor | Impact |
|---|---|
| Ad Rank | Higher QS = better position, even with lower bid |
| Actual CPC | Higher QS = lower CPC (often 20-50% cheaper) |
| Eligibility | Low QS can prevent ads from showing |
| Extensions | High QS makes ad extensions more likely to display |
2. The 3 Components of Quality Score
Google has confirmed that Quality Score is based on these three components:
2.1 Expected Click-Through Rate (Expected CTR)
This is Google's prediction of how likely someone is to click your ad when shown for a specific keyword — regardless of ad position.
What influences it:
- Historical CTR of this exact keyword/ad combination
- CTR of other ads in your account with similar targeting
- Keyword performance across the auction
- Device, location, and audience performance
Expected CTR ratings:
- Above Average — Better than most advertisers targeting the same keywords
- Average — Similar to competitors
- Below Average — Worse than competitors; needs improvement
2.2 Ad Relevance
This measures how closely your ad matches the intent behind the search query.
Ad Relevance ratings:
- Above Average — Your ad text is highly relevant to the keyword/search
- Average — Reasonably related to the search
- Below Average — Generic or poorly matched ad text
Common causes of "Below Average":
- Single keyword ad groups with irrelevant ad copy
- Using the same ad for multiple unrelated keywords
- Missing keyword insertion or dynamic text
2.3 Landing Page Experience
This measures whether your landing page provides a good user experience for people who click your ad.
Landing Page Experience factors:
- Content relevance to the keyword and ad
- Transparency about your business (contact info, physical address)
- Page load speed (especially on mobile)
- Navigability and organization
- Intrusive interstitials (pop-ups, download walls)
- Mobile-friendliness
- Security (HTTPS)
Landing Page Experience ratings:
- Above Average — Highly relevant and transparent
- Average — Relevant but could improve user experience
- Below Average — Poor experience or unclear relevance
3. What Is a Good Quality Score?
| Quality Score | Rating | Typical Impact |
|---|---|---|
| 9-10 | Excellent | 30-50% lower CPC than competitors; best ad positions |
| 7-8 | Good | 15-25% lower CPC; competitive positioning |
| 5-6 | Average | Market-rate CPC; limited ad extensions |
| 3-4 | Below Average | Higher CPC; reduced visibility |
| 1-2 | Poor | Very high CPC; ads may not show |
Industry averages vary significantly:
| Industry | Average QS | Good QS | Excellent QS |
|---|---|---|---|
| Ecommerce | 6-7 | 8 | 9-10 |
| Finance/Insurance | 5-6 | 7 | 8-9 |
| Legal | 6-7 | 8 | 9-10 |
| SaaS/Tech | 7-8 | 9 | 10 |
| Healthcare | 5-6 | 7 | 8-9 |
| Education | 6-7 | 8 | 9-10 |
Average Quality Score across all industries: 6-7. If your account average is below 5, there's significant room for improvement.
4. How Quality Score Affects Your CPC and Ad Rank
Ad Rank Formula
Google's Ad Rank determines ad position:
Ad Rank = Max Bid x Quality Score
More accurately:
Ad Rank = Max Bid x (Expected CTR + Ad Relevance + Landing Page Experience components)
Example: How QS Impacts CPC
| Advertiser | Max Bid | Quality Score | Ad Rank | Position | Actual CPC |
|---|---|---|---|---|---|
| Competitor A | $3.00 | 8 | 24 | 1 | $2.20 |
| You | $4.00 | 4 | 16 | 2 | $3.50 |
| Competitor B | $2.50 | 7 | 17.5 | 1 | $1.80 |
Even though you bid $4.00 (higher than both competitors), your low Quality Score (4) costs you the top position AND forces you to pay $3.50 CPC.
With a QS of 8 and a $3.00 bid: Ad Rank = 24, CPC would be approximately $2.20.
The math: Improving QS from 4 to 8 could cut your CPC from $3.50 to $2.20 — a 37% reduction — without changing your bid.
Calculate your optimal CPC with our CPC Calculator.
5. How to Check Your Quality Score
- Sign in to Google Ads
- Go to Keywords tab
- Click the columns icon (vertical bars) in the toolbar
- Under "Competitive metrics," select Quality Score
- Click Apply
You'll see QS as a number (1-10) and the three component statuses:
- Expected CTR: Above Average / Average / Below Average
- Ad Relevance: Above Average / Average / Below Average
- Landing Page Experience: Above Average / Average / Below Average
Quality Score by Device
Google also shows QS by:
- Mobile
- Desktop
- Tablet
Pro tip: A keyword might have QS 8 on desktop but QS 4 on mobile — this usually means your mobile landing page experience is the problem.
6. 10 Proven Tactics to Improve Quality Score
1. Tighten Keyword-to-Ad Relevance with Single Keyword Ad Groups (SKAGs)
Group one to three closely related keywords per ad group. Then write hyper-specific ad copy for each group.
Before: One ad group with 50 keywords, one generic ad.
After: 17 ad groups, 2-3 keywords each, custom ad per group.
Result: Improved Ad Relevance rating; QS typically increases 1-3 points.
2. Improve Expected CTR with Better Ad Copy
CTR is the most influential component for QS.
Tactics:
- Include the keyword in headline 1 (better yet, headline 1)
- Use keyword insertion:
{KeyWord:Default}in headlines - Add ad extensions (sitelinks, callouts, structured snippets)
- Use numbers and statistics in ads ("50% faster")
- Include benefit-driven CTAs ("Start Free Trial" vs "Click Here")
- Add urgency/scarcity ("Offer ends Friday")
- Test 3-5 ads per ad group, pause underperformers
3. Add Negative Keywords
Negative keywords prevent your ads from showing on irrelevant searches — which kills CTR and Ad Relevance.
High-impact negatives to add:
- Free, cheap, DIY, tutorial (unless you sell those)
- Competitor brand names (unless you sell comparisons)
- Jobs, careers, hiring (unless relevant)
- Irrelevant product categories
- Misspellings that diverge from intent
Rule: Review search terms report weekly and add negatives aggressively. 20-30% of search terms are irrelevant in most accounts.
4. Optimize Landing Pages for Speed and Relevance
Landing Page Experience is the most under-optimized component.
Page speed targets:
- Mobile: < 3 seconds load time
- Desktop: < 2 seconds load time
- Core Web Vitals: All green (LCP < 2.5s, FID < 100ms, CLS < 0.1)
Relevance check: Does the landing page answer the specific query?
- Keyword: "CRM for small business" → Page: "CRM for Small Business — Start Free Trial"
- Keyword: "enterprise CRM pricing" → Page: "Enterprise CRM Pricing & Plans"
5. Match Keywords to Landing Page Content
Create a keyword-to-landing-page map:
| Keyword | Landing Page URL |
|---|---|
| CRM for small business | /crm/small-business |
| best CRM software | /best-crm-software |
| CRM pricing | /pricing |
Avoid sending all keywords to your homepage. Sending keyword-specific traffic to keyword-specific pages dramatically improves Landing Page Experience.
6. Use Responsive Search Ads (RSAs)
Google now recommends RSAs over standard expanded text ads. RSAs automatically test combinations of headlines and descriptions to find the highest-CTR combination.
Best practices:
- Provide 15 headlines per ad group
- Provide 4 descriptions per ad group
- Pin headlines to positions selectively (don't over-pin)
- Use headline assets and description assets for brand messaging
- Review performance weekly and replace low-performing assets
RSAs typically improve CTR by 15-30%, which boosts Expected CTR and Ad Relevance.
7. Target High-Intent Keywords
Long-tail keywords with commercial intent have:
- Higher CTR (more specific = more qualified)
- Lower competition = lower CPC
- Higher conversion rates
Example:
- Broad: "CRM" (low CTR, high CPC, low QS)
- Specific: "CRM for small business under 50 employees" (high CTR, lower CPC, higher QS)
Shift budget from broad match to phrase match and exact match keywords in high-intent segments.
8. Optimize for Mobile
Most Google searches are now mobile. Poor mobile experience = low QS.
Mobile optimization checklist:
- Mobile-friendly design (responsive)
- Fast load times
- Easy-to-click buttons (min 48px touch target)
- Simple forms (fewer fields)
- Click-to-call phone numbers
- No intrusive interstitials
- Consistent mobile and desktop messaging
9. Build Topical Authority
Google assesses your overall account structure and domain authority. Accounts with clean structure and high-authority domains get a QS boost.
Topical authority tactics:
- Organize campaigns by theme/product/category
- Write ad copy that demonstrates expertise
- Use schema.org structured data on landing pages
- Build backlinks to landing pages (improves page authority)
- Maintain consistent NAP (Name, Address, Phone) for local businesses
10. A/B Test Landing Page Elements
Small landing page changes can have outsized QS impact:
| Test | Impact |
|---|---|
| Headline matches keyword | +0.5-1.5 QS points |
| Add trust signals (reviews, logos) | +0.3-1.0 QS points |
| Reduce form fields from 7 to 4 | +0.2-0.8 QS points |
| Improve page load by 1 second | +0.5-1.0 QS points |
| Add FAQ section matching keywords | +0.3-0.7 QS points |
Prioritize tests based on which component is currently "Below Average." Test one change at a time and measure QS weekly.
7. Quality Score Case Study
From a PPC Hero case study on a B2B SaaS account:
| Time Period | Avg QS | CPC | Conversions | Cost/Conv |
|---|---|---|---|---|
| Before optimization | 4.2 | $8.50 | 127 | $68 |
| Week 4 | 5.8 | $6.20 | 189 | $52 |
| Week 8 | 7.1 | $4.80 | 241 | $42 |
| Week 12 | 8.3 | $3.90 | 298 | $36 |
Results: QS improved from 4.2 to 8.3, CPC dropped 54%, conversions increased 135%, cost per conversion dropped 47%.
Changes made:
- Implemented SKAGs with custom ads
- Added 312 negative keywords
- Rewrote ad copy with keyword insertion
- Redesigned top 5 landing pages for speed
- Added 12 RSAs per ad group
8. Common Quality Score Myths
Myth 1: Quality Score is the #1 factor in ad rank
Reality: QS is a diagnostic of the underlying components. Google uses expected impact of extensions, ad format, and bid directly in Ad Rank. QS is useful but not the whole story.
Myth 2: A high QS guarantees top position
Reality: If your competitor bids 3x your bid with the same QS, they win top position. QS reduces the price you pay, not the ad rank calculation alone.
Myth 3: You can game QS with clickbait
Reality: Google has sophisticated systems to detect misleading CTR. Clickbait ads may show initial CTR improvement but get penalized for user experience.
Myth 4: QS updates in real-time
Reality: QS is calculated based on historical performance. Changes to ads/landing pages can take 1-2 weeks to reflect in QS.
Myth 5: QS doesn't matter for brand keywords
Reality: Even for brand terms, QS affects CPC. Perfect QS (10) on brand terms can mean $0.01 CPC vs $1-2 CPC with low QS.
9. Quality Score and Other Metrics: The Full Picture
Quality Score doesn't exist in a vacuum. Pair it with:
| Metric | Relationship to QS | How to Use |
|---|---|---|
| CPC | Higher QS = lower CPC | Use CPC Calculator to model savings |
| CTR | CTR affects Expected CTR component | Use CTR Calculator to benchmark |
| Conversion Rate | Influenced by landing page experience | Track conversion rate by QS tier |
| Ad Position | Higher QS = better position | Monitor position changes after QS improvements |
| Impression Share | Low QS can reduce impression share | Track lost IS (rank) vs lost IS (budget) |
The combined effect: A 2-point QS improvement typically results in:
- 15-30% lower CPC
- 10-20% higher CTR
- 20-40% lower cost per conversion
- 10-25% higher conversion rate (better landing page)
10. Quality Score Monitoring Dashboard
Set up these automated rules or dashboard views:
Weekly Checks
- [ ] Check QS for all active keywords (Google Ads QS column)
- [ ] Identify keywords with QS <= 5 and "Below Average" components
- [ ] Review search terms report for new negative keywords
- [ ] Check landing page speed (PageSpeed Insights)
Monthly Checks
- [ ] Average QS trend across account
- [ ] QS by campaign/ad group
- [ ] QS by device (mobile QS issues are common)
- [ ] CPC trend vs QS trend
Quarterly Checks
- [ ] Competitor QS estimation (use auction insights)
- [ ] Landing page refresh for top 10 converting pages
- [ ] Ad copy audit — replace underperforming ads
Recommended QS Targets
| Metric | Target | Alert Threshold |
|---|---|---|
| Account average QS | >= 7 | < 5 triggers audit |
| % keywords with QS >= 7 | >= 60% | < 40% triggers audit |
| % keywords "Below Average" CTR | < 20% | > 30% triggers audit |
| Mobile landing page speed | < 3 seconds | > 5 seconds triggers fix |
Conclusion
Quality Score is one of the most impactful metrics in Google Ads — yet most accounts ignore it or don't know how to improve it.
The 3 components:
- Expected CTR — Write better ads, use negatives, use RSAs
- Ad Relevance — SKAGs, keyword-specific ad copy
- Landing Page Experience — Speed, relevance, mobile optimization
The quick wins:
- Expected CTR improvements: Rewrite ads with keyword insertion
- Ad Relevance: Restructure into SKAGs
- Landing Page: Speed up top landing pages (one day of work)
The compound effect: A 2-point QS improvement cuts your CPC by 20-50%, reduces cost per conversion by 30-50%, and increases conversions by 20-40%.
Stop bidding higher to compensate for low Quality Score. Fix the underlying components and watch your efficiency skyrocket.
Take Action
- CPC Calculator — Model how QS impacts your CPC
- CTR Calculator — Benchmark your CTR against industry averages
- What Is a Good CTR for Google Search Ads? — Improve Expected CTR
- Break-Even ROAS — Connect Quality Score to profitability
- Google Ads Benchmarks — See how your account compares
FAQ
1. How long does it take to improve Quality Score?
It depends on the component. Expected CTR improvements can show in 1-2 weeks. Landing Page Experience changes take 1-2 weeks to fully impact QS. Full account restructuring may take 1-3 months.
2. Can you have a Quality Score higher than 10?
No. The maximum is 10. If your QS is already 10, focus on other levers: ad extensions, bid strategy, and audience targeting.
3. Does Quality Score matter for Display Network ads?
Quality Score exists for Display campaigns but uses different signals: quality of landing page, past performance on the Google Display Network, and ad format. The 1-10 scale is the same but components differ.
4. Why is my Quality Score different on mobile vs desktop?
Google calculates QS separately by device. Common causes of low mobile QS: slow mobile load times, poor mobile UX, forms that don't work on mobile.
5. Do ad extensions affect Quality Score?
Indirectly. Ad extensions improve Ad Rank and CTR, which improves Expected CTR. They also improve ad format, which Google considers in auctions. But extensions aren't a direct QS component.
6. What's the fastest way to improve Quality Score?
The fastest win is usually Expected CTR — rewrite your top 10% of keywords by spend with better ad copy, add negatives, and switch to RSAs. This can improve QS 1-2 points within 1-2 weeks.
Related Articles
- What Is a Good CTR for Google Search Ads? — CTR benchmarks and how Expected CTR drives Quality Score.
- CPC Calculator — Calculate how Quality Score affects your cost per click.
- CTR Calculator — Benchmark your click-through rate.
- ROAS vs ROI: The Complete Guide — From Quality Score to profitability.
- Google Ads Benchmarks — See CPC and CTR benchmarks by industry.