Key Takeaways:
- A "good" conversion rate depends entirely on your industry, traffic source, and device.
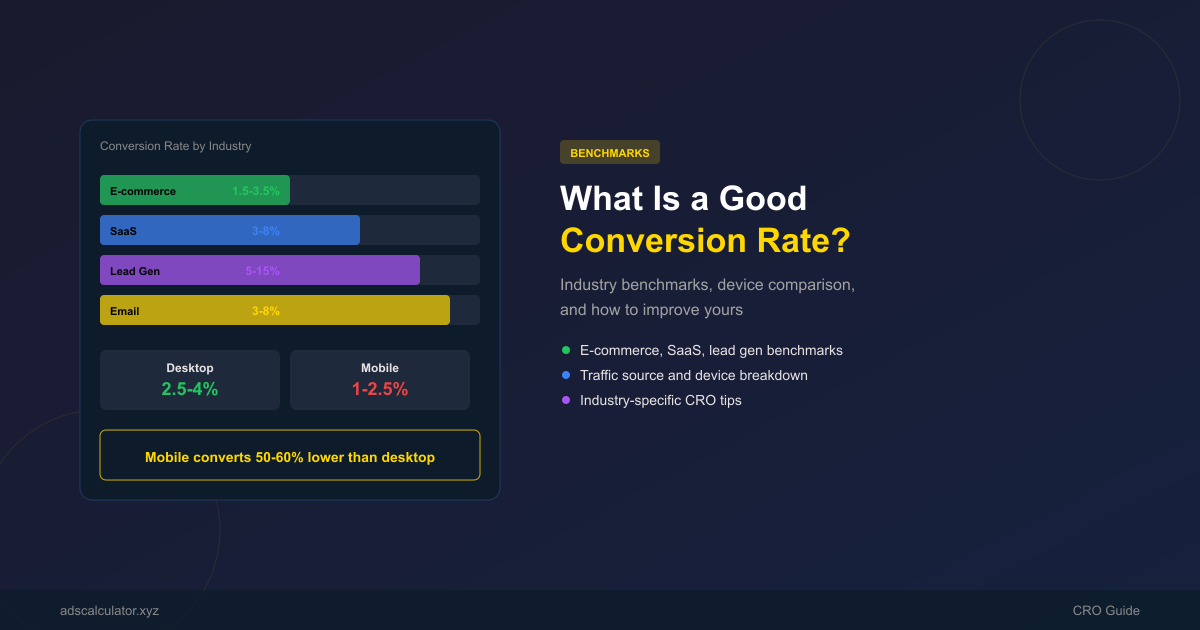
- E-commerce average: 1.5–3.5%. SaaS: 3–8%. Lead gen: 5–15%.
- Mobile converts at 50–60% lower rates than desktop across all industries.
- Top performers achieve 2–3x the industry average through CRO.
Your landing page converts at 2.5%. Is that good? Bad? Average?
The answer depends on who you're comparing yourself to. A 2.5% conversion rate is excellent for a SaaS free trial but below average for an e-commerce product page. A 5% rate is outstanding for a lead gen form but terrible for a checkout page.
This guide gives you the benchmarks you need — by industry, by device, by traffic source — so you can set realistic targets and know where to focus.
What Is Conversion Rate?
Conversion rate is the percentage of visitors who complete a desired action on your website or app.
Conversion Rate = (Number of Conversions / Total Visitors) × 100
A "conversion" can be any action that moves your business forward:
- E-commerce: Making a purchase
- SaaS: Signing up for a free trial or demo
- Lead gen: Filling out a form, downloading content
- Content: Subscribing to a newsletter, watching a video
The key is that conversion rate measures the effectiveness of your page at turning visitors into customers or leads.
Conversion Rate Benchmarks by Industry
E-commerce
| Segment | Average | Good | Excellent |
|---|---|---|---|
| Overall | 1.5–2.5% | 2.5–3.5% | 3.5%+ |
| Fashion & Apparel | 1.5–2.5% | 2.5–4% | 4%+ |
| Electronics | 1–2% | 2–3% | 3%+ |
| Health & Beauty | 2–3% | 3–5% | 5%+ |
| Home & Garden | 1.5–2.5% | 2.5–4% | 4%+ |
| Food & Beverage | 2–3% | 3–5% | 5%+ |
| Luxury Goods | 0.5–1.5% | 1.5–2.5% | 2.5%+ |
E-commerce conversion rates vary widely by product category. Health and beauty products convert higher because they're lower-consideration purchases. Luxury goods convert lower because the buying cycle is longer and more deliberate.
SaaS
| Segment | Average | Good | Excellent |
|---|---|---|---|
| Free Trial Signup | 3–5% | 5–8% | 8%+ |
| Demo Request | 2–4% | 4–7% | 7%+ |
| Paid Plan Purchase | 1–3% | 3–5% | 5%+ |
| Upgrade (Free → Paid) | 2–5% | 5–10% | 10%+ |
SaaS conversion rates are higher than e-commerce because the "purchase" (signing up) is free. The real metric to watch is the free-to-paid conversion rate, which averages 2–5%.
Lead Generation
| Segment | Average | Good | Excellent |
|---|---|---|---|
| B2B Landing Page | 3–5% | 5–10% | 10%+ |
| B2C Landing Page | 5–8% | 8–12% | 12%+ |
| Webinar Registration | 10–20% | 20–30% | 30%+ |
| Content Download | 10–25% | 25–40% | 40%+ |
| Contact Form | 2–5% | 5–10% | 10%+ |
Lead gen conversion rates are higher because the commitment is lower. Someone downloading a free guide is much easier to convert than someone entering credit card information.
By Traffic Source
Your traffic source dramatically affects conversion rates:
| Traffic Source | Typical Conv. Rate | Why |
|---|---|---|
| 3–8% | Warm audience, already knows you | |
| Organic Search | 2–5% | Active intent, researching solutions |
| Direct Traffic | 2–5% | Already familiar with your brand |
| Paid Search | 2–4% | High intent, but varies by keyword |
| Paid Social | 0.5–2% | Cold audience, discovery phase |
| Referral | 2–5% | Trust transfer from referring site |
| Display Ads | 0.3–1% | Coldest traffic, lowest intent |
Key insight: If your overall conversion rate looks low, check your traffic mix. A site with 80% paid social traffic will naturally have a lower conversion rate than one with 80% email traffic.
By Device
| Device | E-commerce Conv. Rate | SaaS Conv. Rate |
|---|---|---|
| Desktop | 2.5–4% | 4–8% |
| Mobile | 1–2.5% | 2–5% |
| Tablet | 2–3.5% | 3–6% |
Mobile converts at 50–60% lower rates than desktop. This isn't because mobile users are less interested — it's because mobile checkout and signup flows are often more friction-heavy. If your mobile conversion rate is significantly below desktop, your mobile UX likely needs work.
What Affects Conversion Rate?
Factors You Can Control
- Page load speed — Every 1-second delay reduces conversions by ~7%
- Call-to-action clarity — One clear CTA outperforms multiple competing CTAs
- Form length — Fewer fields = higher conversion (but lower lead quality)
- Social proof — Testimonials, reviews, trust badges increase conversions by 10–30%
- Offer strength — The value proposition must outweigh the friction of converting
- Mobile optimization — Responsive design, thumb-friendly buttons, fast mobile load times
Factors You Can't Control (But Should Know)
- Industry norms — Some industries simply convert lower
- Price point — Higher prices = lower conversion rates
- Purchase frequency — Frequent purchases convert higher
- Brand awareness — Known brands convert higher than unknown ones
- Traffic temperature — Warm traffic always converts higher than cold
How to Benchmark Your Conversion Rate
Step 1: Calculate Your Current Rate
CR = (Conversions / Total Visitors) × 100
Use Google Analytics 4 or your analytics tool to get accurate numbers. Calculate separately for:
- Overall site
- Each major page type (homepage, product pages, landing pages)
- Each traffic source
- Each device type
Step 2: Compare to Industry Benchmarks
Use the tables above to find your industry and segment. Don't compare yourself to companies in different industries — an e-commerce store shouldn't benchmark against a SaaS company.
Step 3: Identify the Gap
If you're below industry average, the gap is likely in:
- Traffic quality (wrong audience)
- Page experience (slow, confusing, not mobile-friendly)
- Offer (not compelling enough)
- Trust (no social proof, unclear policies)
Step 4: Run A/B Tests
Focus on one element at a time:
- Headlines and value propositions
- CTA button text, color, and placement
- Form length and fields
- Social proof placement
- Page layout and design
Conversion Rate vs. Other Metrics
Conversion rate doesn't exist in isolation. Here's how it connects:
| Metric | Relationship |
|---|---|
| CPA | Higher CR = Lower CPA (same traffic, more conversions) |
| ROAS | Higher CR = Higher ROAS (more revenue from same ad spend) |
| AOV | Lower CR can be offset by Higher AOV |
| Traffic | More traffic at same CR = more total conversions |
| LTV | Lower CR may be acceptable if LTV is very high |
Example: If your CR is 1% but your AOV is $500 and your LTV is $2,000, you're still highly profitable. Don't chase conversion rate at the expense of customer quality.
Industry-Specific Tips
E-commerce
- Optimize your checkout flow (every unnecessary field costs conversions)
- Add trust badges near the purchase button
- Show shipping costs early (surprise costs are the #1 cart abandonment reason)
- Use product reviews and ratings prominently
SaaS
- Reduce friction in signup (social login, minimal fields)
- Show product value before asking for commitment (interactive demos, free trials)
- Use social proof from recognizable companies
- A/B test your pricing page relentlessly
Lead Generation
- Match ad copy to landing page headline (message match)
- Reduce form fields to the minimum needed
- Add a privacy statement near the submit button
- Use multi-step forms for higher-commitment offers
Conclusion
There's no universal "good" conversion rate. A good rate is one that's at or above your industry average, improving over time, and profitable when combined with your AOV and LTV.
Start by calculating your current rate. Compare it to the benchmarks above. Then focus on the highest-impact improvements: page speed, mobile optimization, CTA clarity, and social proof.
Calculate your conversion rate and optimize your funnel with our CPA Calculator and CPC Calculator.
Related Articles
- CRO: Complete Guide to More Conversions (2025) — How to systematically improve your conversion rate.
- Bounce Rate: What It Is & How to Reduce It — Reduce bounces to improve overall conversion.
- A/B Testing: Complete Guide (2025) — Test your CRO hypotheses with statistical validity.
- Break-Even ROAS: The Most Important Number — Know your minimum viable ROAS.
FAQ
1. What is a good conversion rate for e-commerce?
The average e-commerce conversion rate is 1.5–2.5%. A "good" rate is 2.5–3.5%, and anything above 3.5% is excellent. However, this varies significantly by product category — health and beauty products often convert at 3–5%, while luxury goods may only reach 1–2%.
2. Is a 1% conversion rate good?
It depends on your industry. For e-commerce, 1% is below average. For SaaS demo requests, it's decent. For display advertising landing pages, it's actually quite good. Always compare to your specific industry benchmark.
3. Why is my mobile conversion rate so much lower than desktop?
Mobile users face more friction: smaller screens, slower load times, harder form filling, and more distractions. Optimize your mobile experience with thumb-friendly buttons, simplified forms, and fast load times to close the gap.
4. How much can I realistically improve my conversion rate?
With systematic CRO (A/B testing, UX improvements, better copy), most sites can improve their conversion rate by 20–50% within 6–12 months. Top performers achieve 2–3x improvement over time.
5. Should I focus on conversion rate or traffic?
Both matter, but conversion rate is often the better starting point. Increasing traffic by 50% is expensive. Increasing conversion rate by 50% is often free — it just requires optimization. Once your rate is optimized, invest in traffic.
Related Calculators
- CPA Calculator — Calculate cost per acquisition
- CPC Calculator — Calculate cost per click
- ROAS Calculator — Calculate return on ad spend
- Break-Even ROAS Calculator — Find your minimum viable ROAS