Key Takeaways:
- Only 32% of marketers measure content ROI holistically — the rest fly blind.
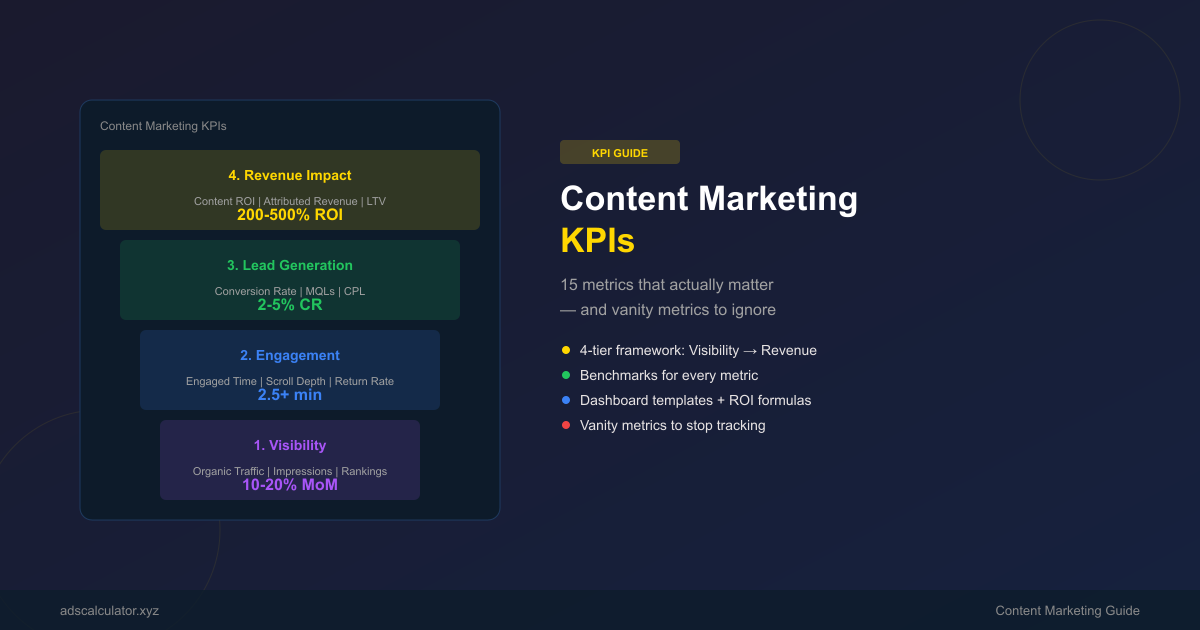
- Track 4 tiers: Visibility → Engagement → Lead Generation → Revenue Impact.
- Pageviews are a vanity metric. Engaged time and conversion rate are KPIs.
- Content marketing generates 3x more leads at 62% of the cost of outbound advertising.
You publish 20 blog posts. Traffic goes up. But did any of it generate revenue?
Most content teams can't answer that question. They track pageviews and social shares — numbers that feel good but don't prove business value. Meanwhile, leadership asks "is content working?" and nobody has a real answer.
This guide covers the 15 content marketing KPIs that actually matter — organized by funnel stage — so you can prove ROI and earn your budget.
The 4-Tier Content KPI Framework
Content performance isn't one number — it's a chain. Each tier feeds the next:
| Tier | Question | Key Metrics |
|---|---|---|
| 1. Visibility | Did people find it? | Organic traffic, impressions, search rankings |
| 2. Engagement | Did they care? | Time on page, scroll depth, return visits |
| 3. Lead Generation | Did they act? | Conversions, email signups, downloads |
| 4. Revenue Impact | Did it make money? | Pipeline influenced, revenue attributed, ROI |
Most teams only track Tier 1. The best teams track all four.
Tier 1: Visibility KPIs
These tell you if your content is being discovered.
1. Organic Traffic
The number of visitors finding your content through search engines.
Growth Rate = ((This Month − Last Month) / Last Month) × 100
- Benchmark: 10–20% month-over-month growth is strong for established sites
- Tool: Google Analytics 4 → Reports → Acquisition → Traffic acquisition
- Watch for: Traffic that doesn't convert — high traffic with zero conversions means you're attracting the wrong audience
2. Search Impressions
How often your content appears in search results, regardless of clicks.
- Benchmark: Growing impressions = improving SEO authority
- Tool: Google Search Console → Performance
- Key insight: Impressions growing but CTR falling = your titles/descriptions need work
3. Keyword Rankings
Where your content ranks for target keywords.
- Benchmark: Top 3 positions capture ~55% of all clicks
- Track: Average position for your top 20 target keywords
- Tool: Google Search Console, Ahrefs, or SEMrush
4. Backlinks
External sites linking to your content — a key SEO authority signal.
- Benchmark: Quality over quantity. 5 links from authoritative sites > 100 from low-quality sites
- Track: New backlinks per month, referring domains
Tier 2: Engagement KPIs
Traffic means nothing if people bounce immediately.
5. Engaged Time (Avg. Session Duration)
How long visitors actually spend with your content.
Engaged Time = Time on page with active interaction (scrolls, clicks, typing)
- Benchmark: 2+ minutes for blog posts is good; 3+ minutes is excellent
- GA4 metric: "Average engagement time per session"
- Why it matters: Google uses engagement signals as ranking factors. Longer engagement = better rankings
6. Scroll Depth
How far down the page readers scroll.
- Benchmark: 70%+ scroll depth for long-form content
- Tool: Google Analytics 4 (enhanced measurement) or Hotjar
- Tip: If most readers drop off at 30%, your introduction isn't hooking them
7. Return Visitor Rate
The percentage of visitors who come back.
Return Rate = (Returning Visitors / Total Visitors) × 100
- Benchmark: 25–40% for content sites
- Why it matters: Return visitors are your audience. They're more likely to convert, share, and buy.
8. Pages Per Session
How many pages a visitor views in one session.
- Benchmark: 2–3 pages per session for content sites
- Tip: Internal links between related posts increase pages per session
Tier 3: Lead Generation KPIs
Engagement is nice. Conversions pay the bills.
9. Content Conversion Rate
The percentage of content visitors who take a desired action.
Content CR = (Conversions from Content / Content Visitors) × 100
| Content Type | Average CR | Good CR |
|---|---|---|
| Blog post (email signup) | 1–3% | 3–5% |
| Landing page (lead form) | 3–7% | 7–12% |
| Gated content (download) | 5–15% | 15–25% |
| Webinar registration | 10–20% | 20–30% |
10. Email Subscriber Growth Rate
How fast your email list is growing from content.
Growth Rate = ((New Subscribers − Unsubscribes) / Total Subscribers) × 100
- Benchmark: 2–5% monthly growth is healthy
- Tip: Content upgrades (bonus downloads) convert 3–5x better than generic signup forms
11. Marketing Qualified Leads (MQLs) from Content
Leads generated specifically through content consumption.
- Track: Use UTM parameters to attribute leads to specific posts
- Benchmark: Varies by industry — track your own trend line
- Tool: CRM (HubSpot, Salesforce) with content attribution
12. Cost Per Lead (CPL) from Content
How much you spend to generate each lead through content.
Content CPL = Total Content Spend / Leads Generated from Content
- Benchmark: Content marketing CPL is typically 50–70% lower than paid advertising CPL
- Why it matters: This is the number that proves content ROI to leadership
Tier 4: Revenue Impact KPIs
The metrics that justify your entire content budget.
13. Content-Attributed Revenue
Revenue from deals that originated with or were influenced by content.
- Track: Multi-touch attribution in your CRM
- Benchmark: Companies with mature content programs attribute 20–40% of pipeline to content
- Tool: HubSpot, Salesforce, or Google Analytics 4 attribution
14. Content ROI
The ultimate metric — are you making more than you spend?
Content ROI = ((Revenue from Content − Content Cost) / Content Cost) × 100
- Benchmark: 200–500% ROI is typical for mature content programs
- Content cost includes: Writer fees, tools, promotion, design
- Tip: Content has compounding ROI — a post published today can generate revenue for years
15. Customer Lifetime Value from Content
The long-term value of customers acquired through content vs. other channels.
- Benchmark: Content-acquired customers often have 15–25% higher LTV than paid-ad customers
- Why: Content builds trust and educates buyers before they convert
- Track: Compare LTV by acquisition channel in your CRM
Vanity Metrics to Stop Tracking
| Vanity Metric | Why It's Misleading | Track This Instead |
|---|---|---|
| Pageviews | Doesn't measure quality or conversion | Engaged time + conversion rate |
| Social shares | Doesn't correlate with revenue | Lead gen from social |
| Likes/comments | Engagement without intent | Email signups, downloads |
| Total followers | Vanity audience | Subscriber growth rate |
| Impressions | Seen ≠ read | Click-through rate + engaged time |
| Bounce rate (alone) | Can be good for single-page visits | Scroll depth + pages per session |
How to Build a Content KPI Dashboard
Weekly Check (Tactical)
- Organic traffic (this week vs. last)
- New posts published
- Email signups from content
- Top 5 performing posts by traffic
Monthly Review (Strategic)
- Content conversion rate by post
- MQLs from content
- Content CPL vs. paid CPL
- Keyword ranking changes
- Backlinks acquired
Quarterly Business Review
- Content-attributed revenue
- Content ROI
- Customer LTV by acquisition channel
- Content budget allocation for next quarter
Benchmarks Summary
| KPI | Average | Good | Excellent |
|---|---|---|---|
| Organic traffic growth | 5–10%/mo | 10–20%/mo | 20%+/mo |
| Engaged time (blog) | 1.5 min | 2.5 min | 3.5+ min |
| Content conversion rate | 1–2% | 2–4% | 4%+ |
| Email subscriber growth | 1–2%/mo | 2–5%/mo | 5%+/mo |
| Content CPL | $30–$80 | $15–$30 | <$15 |
| Content ROI | 100–200% | 200–400% | 400%+ |
| Return visitor rate | 15–25% | 25–35% | 35%+ |
Conclusion
Content marketing without KPI tracking is just blogging for fun. The best content teams measure what matters at every funnel stage — from discovery to revenue.
Start with the metrics that connect to business outcomes: conversion rate, leads generated, and revenue attributed. Build your dashboard around those. Everything else is context.
Calculate your content marketing ROI with our ROAS Calculator and CPA Calculator.
Related Articles
- 25 Marketing KPIs & Metrics Every Marketer Should Track — The complete KPI reference.
- How to Calculate Email Marketing ROI — Measure email content performance.
- CRO: Complete Guide to More Conversions (2025) — Improve your content conversion rate.
- What Is a Good Conversion Rate? Benchmarks by Industry — Conversion benchmarks by sector.
FAQ
1. What is the most important content marketing KPI?
Content-attributed revenue. It directly connects your content investment to business outcomes. If you can prove content drives revenue, every other KPI becomes easier to justify.
2. How do I attribute revenue to content?
Use multi-touch attribution in your CRM. Track which content pieces a lead consumed before converting. Even first-touch attribution (which content brought them to your site) is better than nothing.
3. What is a good content conversion rate?
For blog-to-email signups: 2–4% is good. For gated content downloads: 10–20% is good. For landing pages: 5–10% is good. Always benchmark against your own historical data first.
4. How much should I spend on content marketing?
B2B companies typically allocate 25–35% of their marketing budget to content. B2C companies allocate 15–25%. The key metric is content ROI — if you're seeing 300%+ ROI, you should be spending more.
5. How long does content marketing take to show results?
Expect 3–6 months for initial traction and 6–12 months for meaningful ROI. Content marketing compounds over time — a post published today can generate traffic and leads for years.
Related Calculators
- ROAS Calculator — Calculate return on ad spend
- CPA Calculator — Calculate cost per acquisition
- CPC Calculator — Calculate cost per click
- ROI & LTV Calculator — Factor in customer lifetime value