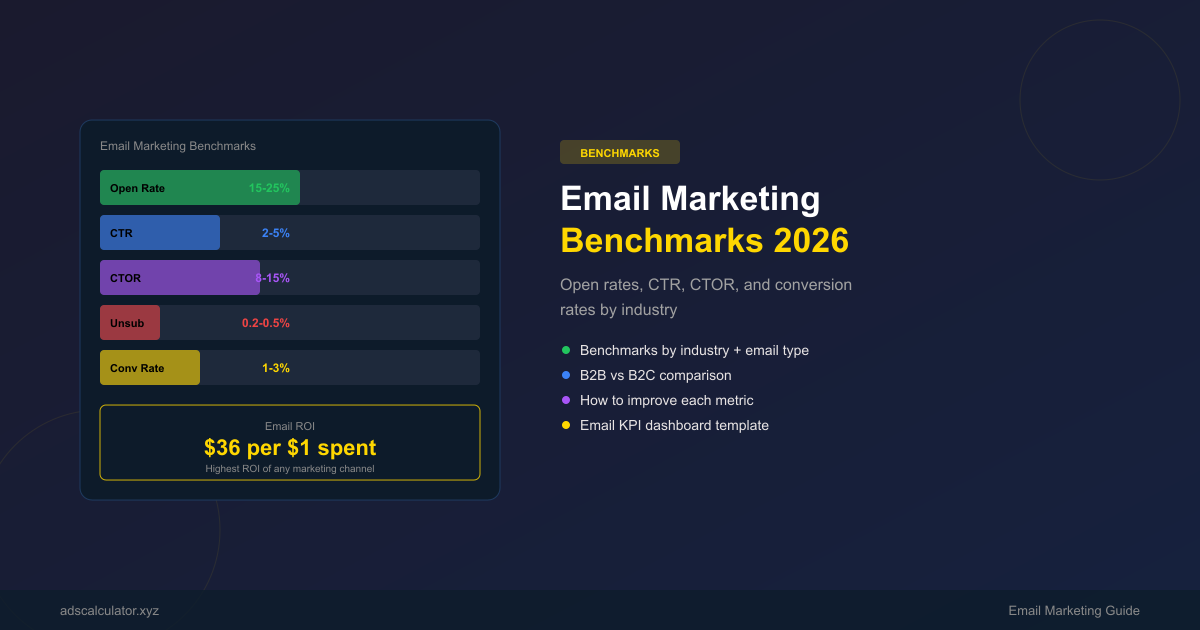
Key Takeaways:
- Average email open rate across industries: 15–25%. Above 25% is excellent.
- Average click-through rate: 2–5%. Above 5% is excellent.
- B2B emails have higher open rates but lower CTR. B2C has lower opens but higher CTR.
- Email delivers $36 for every $1 spent — the highest ROI of any marketing channel.
Your email campaign hit a 22% open rate. Is that good? What about your 3% click-through rate?
Email marketing benchmarks vary wildly by industry, audience type, and email format. A 20% open rate is excellent for e-commerce but below average for SaaS. A 4% CTR is outstanding for newsletters but low for promotional campaigns.
This guide gives you the benchmarks you need — by industry, by email type, by audience — so you can set realistic targets and know where to improve.
Why Email Benchmarks Matter
Email marketing delivers an average $36 for every $1 spent — the highest ROI of any digital marketing channel. But "average" hides enormous variation.
A B2B SaaS company sending product updates will have very different benchmarks than a B2C e-commerce brand sending promotional offers. Comparing yourself to the wrong benchmark leads to wrong conclusions.
Use these benchmarks as directional guidance. Your own historical data is always the most important benchmark.
Email Marketing Benchmarks by Industry
Open Rate by Industry
Open rate = percentage of delivered emails that were opened.
| Industry | Average | Good | Excellent |
|---|---|---|---|
| Overall | 15–25% | 25–35% | 35%+ |
| B2B SaaS | 20–28% | 28–35% | 35%+ |
| B2B Services | 18–25% | 25–32% | 32%+ |
| E-commerce (B2C) | 12–18% | 18–25% | 25%+ |
| Media/Publishing | 18–25% | 25–30% | 30%+ |
| Nonprofit | 20–28% | 28–35% | 35%+ |
| Education | 20–27% | 27–33% | 33%+ |
| Healthcare | 18–24% | 24–30% | 30%+ |
| Real Estate | 15–22% | 22–28% | 28%+ |
| Finance/Insurance | 18–25% | 25–32% | 32%+ |
Click-Through Rate (CTR) by Industry
CTR = percentage of delivered emails that received at least one click.
| Industry | Average | Good | Excellent |
|---|---|---|---|
| Overall | 2–5% | 5–8% | 8%+ |
| B2B SaaS | 2.5–4% | 4–6% | 6%+ |
| B2B Services | 2–4% | 4–6% | 6%+ |
| E-commerce (B2C) | 1.5–3% | 3–5% | 5%+ |
| Media/Publishing | 3–6% | 6–10% | 10%+ |
| Nonprofit | 2–4% | 4–6% | 6%+ |
| Education | 2.5–4.5% | 4.5–7% | 7%+ |
| Healthcare | 2–3.5% | 3.5–5% | 5%+ |
| Real Estate | 1.5–3% | 3–5% | 5%+ |
| Finance/Insurance | 2–4% | 4–6% | 6%+ |
Click-to-Open Rate (CTOR) by Industry
CTOR = percentage of opened emails that received a click. This measures how compelling your email content is.
| Industry | Average | Good | Excellent |
|---|---|---|---|
| Overall | 8–15% | 15–20% | 20%+ |
| B2B SaaS | 10–15% | 15–20% | 20%+ |
| E-commerce | 8–12% | 12–18% | 18%+ |
| Media/Publishing | 12–18% | 18–25% | 25%+ |
Unsubscribe Rate by Industry
| Industry | Average | Good | Excellent |
|---|---|---|---|
| Overall | 0.2–0.5% | <0.2% | <0.1% |
| B2B | 0.1–0.3% | <0.1% | <0.05% |
| B2C | 0.3–0.6% | <0.3% | <0.15% |
Rule of thumb: Above 0.5% unsubscribe rate per send = you're emailing too frequently or your content isn't relevant.
Conversion Rate by Industry
Conversion rate = percentage of delivered emails that resulted in a desired action (purchase, signup, download).
| Industry | Average | Good | Excellent |
|---|---|---|---|
| Overall | 1–3% | 3–5% | 5%+ |
| E-commerce | 1–2.5% | 2.5–4% | 4%+ |
| B2B SaaS | 2–4% | 4–7% | 7%+ |
| Lead Generation | 2–5% | 5–8% | 8%+ |
Benchmarks by Email Type
The type of email dramatically affects benchmarks:
| Email Type | Avg. Open Rate | Avg. CTR | Why |
|---|---|---|---|
| Welcome email | 40–60% | 5–10% | High intent, fresh subscriber |
| Transactional | 30–50% | 3–7% | Expected, high relevance |
| Newsletter | 15–25% | 2–5% | Regular cadence, mixed interest |
| Promotional | 12–20% | 1.5–3% | Commercial intent, lower trust |
| Re-engagement | 8–15% | 1–3% | Cold audience |
| Cold outreach | 15–25% | 1–3% | Unknown sender |
Key insight: Welcome emails outperform every other type by 2–3x. Invest in your welcome sequence.
B2B vs. B2C Email Benchmarks
| Metric | B2B | B2C |
|---|---|---|
| Open rate | 20–28% | 12–18% |
| CTR | 2.5–4% | 1.5–3% |
| CTOR | 10–15% | 8–12% |
| Unsubscribe rate | 0.1–0.3% | 0.3–0.6% |
| Best send time | Tue–Thu, 9–11 AM | Tue–Thu, 6–8 PM |
| Best frequency | 1–2x/week | 2–4x/week |
B2B emails have higher open rates because professionals check email during work hours. B2C emails have lower opens but can drive more impulse purchases.
How to Improve Your Email Benchmarks
Open Rate
- Subject line optimization — Test length (6–10 words), personalization, urgency
- Preview text — Don't waste it. Complement the subject line
- Sender name — Use a real person's name, not a company name
- Send time — Test Tuesday–Thursday, 9–11 AM for B2B; 6–8 PM for B2C
- List hygiene — Remove inactive subscribers (no opens in 90 days)
Click-Through Rate
- Single CTA — One clear CTA outperforms multiple competing CTAs
- Button vs. link — Buttons get 2–3x more clicks than text links
- Personalization — Beyond "Hi {name}" — segment by behavior and interest
- Mobile optimization — 60%+ of emails are opened on mobile
- Content relevance — Match email content to the subscriber's stage in the funnel
Conversion Rate
- Landing page alignment — Match email message to landing page headline
- Reduce friction — Fewer form fields, clear value proposition
- Social proof — Testimonials, ratings, trust badges near the CTA
- Urgency — Limited-time offers, stock scarcity (when genuine)
- Segmentation — Send the right offer to the right segment
Unsubscribe Rate
- Set expectations — Tell subscribers what they'll get and how often
- Frequency caps — Don't email more than your audience expects
- Preference center — Let subscribers choose frequency and content type
- Re-engagement before removal — Win back inactive subscribers before they unsubscribe
Email Marketing ROI
The most important email metric:
Email ROI = ((Revenue from Email − Email Cost) / Email Cost) × 100
| Industry | Avg. Email ROI |
|---|---|
| Overall | 3,600% ($36 per $1) |
| E-commerce | 4,200% |
| B2B SaaS | 3,000% |
| Media/Publishing | 2,800% |
Email's high ROI comes from low cost (email platforms are cheap) and high conversion potential (you're reaching people who opted in).
Email KPI Dashboard
Weekly Check
- Open rate (this send vs. average)
- CTR (this send vs. average)
- Unsubscribe rate
- Top performing email by CTR
Monthly Review
- List growth rate (new subscribers − unsubscribes)
- Average open rate (trending up or down?)
- Average CTR (trending up or down?)
- Revenue per email sent
- Email ROI
Quarterly Strategy
- Segmentation performance (which segments convert best?)
- Send frequency optimization
- Subject line A/B test results
- List hygiene (remove inactive subscribers)
Conclusion
Email benchmarks are directional, not absolute. A 20% open rate might be excellent for your industry or below average — it depends on your audience, your list quality, and your email type.
Start by calculating your current benchmarks. Compare them to the industry averages above. Then focus on the highest-impact improvements: subject lines, list hygiene, segmentation, and mobile optimization.
Calculate your email marketing ROI with our Email ROI Calculator and ROAS Calculator.
Related Articles
- How to Calculate Email Marketing ROI — The complete email ROI guide.
- Content Marketing KPIs: 15 Metrics That Matter — Measure content performance.
- What Is a Good Conversion Rate? Benchmarks by Industry — Conversion benchmarks.
- Marketing Funnel Explained: TOFU, MOFU, BOFU — Email covers all funnel stages.
FAQ
1. What is a good email open rate?
The average open rate is 15–25%. Above 25% is good. Above 35% is excellent. However, this varies by industry — B2B SaaS averages 20–28%, while e-commerce averages 12–18%.
2. What is a good click-through rate for email?
The average CTR is 2–5%. Above 5% is good. Above 8% is excellent. Newsletters and media companies tend to have higher CTRs than promotional emails.
3. How often should I send emails?
B2B: 1–2 times per week. B2C: 2–4 times per week. The best frequency is the one your audience expects — set expectations at signup and honor them.
4. What is the best day to send emails?
Tuesday through Thursday consistently outperform Monday and Friday. For B2B: 9–11 AM. For B2C: 6–8 PM. But always test with your own audience.
5. How do I improve my email deliverability?
Authenticate your domain (SPF, DKIM, DMARC). Maintain list hygiene (remove bounces and inactive subscribers). Avoid spam trigger words. Keep your sender reputation high by sending consistently.
Related Calculators
- ROAS Calculator — Calculate return on ad spend
- CPA Calculator — Calculate cost per acquisition
- CPC Calculator — Calculate cost per click
- ROI & LTV Calculator — Factor in customer lifetime value