Key Takeaways:
- A marketing dashboard is a single view of your most important metrics — updated in real time.
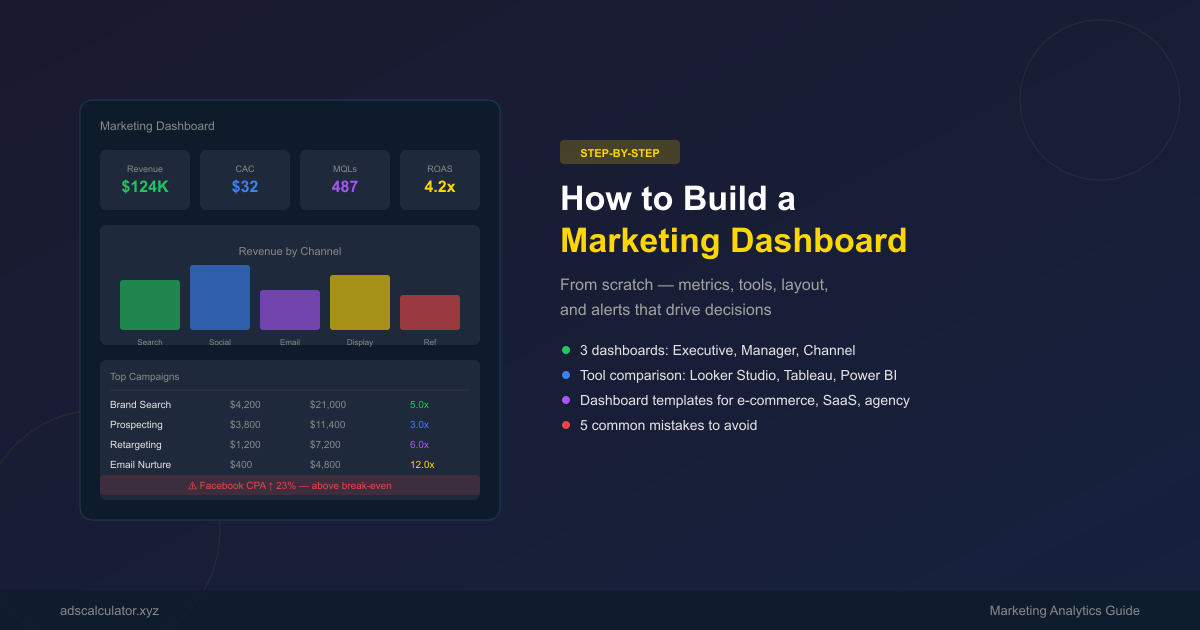
- Build 3 dashboards: Executive (weekly), Manager (daily), Channel (real-time).
- Include only metrics that change your decisions. If a number moves and you don't act, remove it.
- Best tools: Google Looker Studio (free), Tableau, Power BI, Databox.
You open 12 tabs to check your marketing performance. Google Analytics for traffic. Ads Manager for ad spend. Your CRM for leads. Email platform for open rates. Spreadsheet for revenue.
By the time you've pieced together the full picture, it's tomorrow.
A marketing dashboard solves this. It pulls all your metrics into one view — updated in real time — so you can see what's working, what's broken, and what to do next.
What Is a Marketing Dashboard?
A marketing dashboard is a single screen that displays your most important marketing metrics in real time. It answers three questions at a glance:
- How are we doing? — Current performance vs. targets
- What's working? — Channels and campaigns driving results
- What needs attention? — Metrics that are off track
Dashboard vs. Report
| Dashboard | Report | |
|---|---|---|
| Frequency | Real-time or daily | Weekly, monthly, quarterly |
| Purpose | Monitor and react | Analyze and plan |
| Audience | Marketing team | Leadership, stakeholders |
| Content | Key metrics only | Deep analysis, context |
| Format | Live, interactive | Static, PDF or slide deck |
You need both. Dashboards for daily management. Reports for strategic decisions.
The 3 Dashboards Every Marketing Team Needs
1. Executive Dashboard (Weekly)
Audience: CMO, VP of Marketing, CEO
Purpose: High-level business health
Update frequency: Weekly
| Metric | Why It Matters |
|---|---|
| Total marketing spend | Budget tracking |
| Revenue attributed to marketing | ROI proof |
| Customer Acquisition Cost (CAC) | Efficiency |
| Marketing Qualified Leads (MQLs) | Pipeline health |
| Conversion rate (overall) | Funnel efficiency |
| ROAS by channel | Channel performance |
Keep it to 6–8 metrics max. Executives don't need granularity. They need to know: Are we on track? What's the one thing I should worry about?
2. Manager Dashboard (Daily)
Audience: Marketing managers, team leads
Purpose: Day-to-day campaign management
Update frequency: Daily
| Metric | Why It Matters |
|---|---|
| Spend by channel (today, this week, this month) | Budget pacing |
| Impressions, clicks, CTR | Campaign reach and engagement |
| Conversions by campaign | What's working |
| CPA by channel | Efficiency comparison |
| Lead volume and quality | Pipeline progress |
| Email performance (open rate, CTR) | Email health |
| Website traffic by source | Content and SEO performance |
This is your working dashboard. It should help you make daily decisions: Which campaign to scale? Which to pause? Where to shift budget?
3. Channel Dashboard (Real-Time)
Audience: Specialists (paid ads, email, SEO, content)
Purpose: Channel-specific optimization
Update frequency: Real-time or hourly
Paid Ads Dashboard:
- Spend, impressions, clicks, CTR, CPC, conversions, CPA, ROAS
- By campaign, ad set, and ad level
Email Dashboard:
- Sends, deliveries, open rate, CTR, CTOR, unsubscribes, conversions
- By campaign and automated sequence
SEO/Content Dashboard:
- Organic traffic, keyword rankings, impressions, CTR
- By page and content pillar
Social Dashboard:
- Followers, reach, engagement rate, clicks, conversions
- By platform and post type
How to Build a Marketing Dashboard: Step by Step
Step 1: Define Your Goals
Before choosing metrics, define what you're trying to achieve:
| Goal | Key Metrics |
|---|---|
| Increase revenue | Revenue, ROAS, conversion rate, AOV |
| Reduce acquisition cost | CPA, CAC, lead quality score |
| Improve brand awareness | Impressions, reach, share of voice |
| Grow email list | Subscriber growth rate, signup conversion rate |
| Improve retention | Churn rate, LTV, repeat purchase rate |
Step 2: Choose Your Metrics
Use the KPI frameworks from our other guides:
- Marketing KPIs — 25 core metrics
- Content KPIs — Content-specific metrics
- Email Benchmarks — Email metrics
Rule of thumb: 5–8 metrics per dashboard. More than 10 and you're not focusing — you're drowning.
Step 3: Choose Your Tool
| Tool | Best For | Cost | Learning Curve |
|---|---|---|---|
| Google Looker Studio | Most teams | Free | Low |
| Google Sheets | Small teams, simple dashboards | Free | Low |
| Databox | Mobile-first, alerts | $72+/mo | Low |
| Tableau | Enterprise, complex data | $75+/mo | High |
| Power BI | Microsoft ecosystem | $10+/mo | Medium |
| Klipfolio | Real-time dashboards | $49+/mo | Medium |
Recommendation: Start with Google Looker Studio (free, connects to Google Analytics, Google Ads, and most platforms). Upgrade when you need more.
Step 4: Connect Your Data Sources
Common data sources to connect:
| Source | What It Provides |
|---|---|
| Google Analytics 4 | Website traffic, conversions, user behavior |
| Google Ads | Ad spend, clicks, impressions, conversions |
| Meta Ads Manager | Facebook/Instagram ad performance |
| Email platform (Klaviyo, Mailchimp) | Email metrics |
| CRM (HubSpot, Salesforce) | Leads, pipeline, revenue |
| Google Search Console | SEO performance, keyword rankings |
| Social platforms | Social engagement, reach |
Step 5: Design Your Layout
Executive Dashboard Layout:
┌─────────────────────────────────────────────────┐
│  MARKETING EXECUTIVE DASHBOARD    [Date Range]  │
├────────────┬────────────┬────────────┬──────────┤
│  Revenue   │    CAC     │   MQLs     │   ROAS   │
│  $124,500  │   $32      │   487      │   4.2x   │
│  ↑ 12%     │  ↓ 8%      │  ↑ 23%     │  ↑ 5%    │
├────────────┴────────────┴────────────┴──────────┤
│  SPEND BY CHANNEL          │  CONVERSION FUNNEL  │
│  [Pie chart]               │  [Funnel chart]     │
├────────────────────────────┴─────────────────────┤
│  TOP 5 CAMPAIGNS BY REVENUE                      │
│  [Table: Campaign | Spend | Revenue | ROAS]     │
└─────────────────────────────────────────────────┘
Manager Dashboard Layout:
┌─────────────────────────────────────────────────┐
│  MARKETING MANAGER DASHBOARD      [Today/Week]  │
├────────────┬────────────┬────────────┬──────────┤
│  Spend     │  Clicks    │  Conv.     │  CPA     │
│  $4,200    │  12,400    │   310      │  $13.50  │
├────────────┴────────────┴────────────┴──────────┤
│  CHANNEL PERFORMANCE    │  CAMPAIGN SPEND       │
│  [Bar chart]            │  [Table + sparkline]  │
├─────────────────────────┴───────────────────────┤
│  ALERTS: ⚠️ Facebook CPA ↑ 23%  ⚠️ Email CTR ↓  │
└─────────────────────────────────────────────────┘
Step 6: Set Up Alerts
Don't just look at your dashboard — set alerts for when metrics go off track:
| Alert | Threshold | Action |
|---|---|---|
| CPA exceeds break-even | CPA > $35 | Pause or optimize campaign |
| Conversion rate drops | CR < 1.5% | Check landing page, traffic quality |
| Spend pacing too fast | >110% of daily budget | Reduce bids or pause |
| Email unsubscribe rate spikes | >0.5% per send | Check email content, frequency |
| Organic traffic drops | >20% week-over-week | Check for algorithm updates, technical issues |
Step 7: Review and Iterate
Weekly review (15 minutes):
- What changed since last week?
- Which metrics are off track?
- What actions will you take?
Monthly review (1 hour):
- Are the right metrics on the dashboard?
- Is anything missing?
- Can you remove any metrics that don't drive decisions?
Quarterly review (half day):
- Does the dashboard still align with business goals?
- Do you need new data sources?
- Is the dashboard actually being used?
Dashboard Templates
Template 1: E-commerce Marketing Dashboard
| Section | Metrics |
|---|---|
| Revenue | Total revenue, revenue by channel, AOV, LTV |
| Acquisition | Traffic, new vs. returning, CAC, CPA by channel |
| Conversion | Conversion rate, cart abandonment, checkout rate |
| Retention | Repeat purchase rate, churn, email engagement |
| Spend | Ad spend by channel, ROAS, budget pacing |
Template 2: SaaS Marketing Dashboard
| Section | Metrics |
|---|---|
| Pipeline | MQLs, SQLs, opportunities, pipeline value |
| Acquisition | Signups, trial starts, CAC, CPA by channel |
| Activation | Activation rate, time to first value |
| Retention | Churn rate, NPS, expansion revenue |
| Revenue | MRR, ARR, LTV, net revenue retention |
Template 3: Agency Marketing Dashboard
| Section | Metrics |
|---|---|
| Client Overview | Active clients, total spend, total revenue |
| Performance | ROAS by client, CPA by campaign, conversion rate |
| Efficiency | Hours spent, revenue per hour, margin by client |
| Pipeline | Proposals sent, close rate, new client value |
Common Dashboard Mistakes
1. Too Many Metrics
If your dashboard has 30 metrics, it has zero metrics. Every metric should answer "so what?" If you can't explain what action you'd take based on a number, remove it.
2. No Context
A number without context is meaningless. "CPA is $25" tells you nothing. "CPA is $25, up from $18 last month, break-even is $35" tells you everything.
Always include:
- Current value
- Comparison (last period, target, benchmark)
- Trend direction (↑ ↓ →)
3. Vanity Metrics
Pageviews, impressions, and followers look impressive but don't drive decisions. Focus on metrics connected to revenue: conversions, CPA, ROAS, pipeline.
4. No Alerts
A dashboard you check once a week is a report. Set real-time alerts for critical metrics so you can react fast.
5. Not Sharing It
A dashboard only works if the team uses it. Share it in Slack, display it on a screen, review it in team meetings. Make it part of your workflow.
Conclusion
A marketing dashboard isn't a nice-to-have — it's how you make data-driven decisions at speed. Start simple: pick 5 metrics, connect your data sources, and review daily. Add complexity as you go.
The best dashboard is the one your team actually uses. Build for decisions, not for looks.
Track your dashboard metrics with our ROAS Calculator, CPA Calculator, and CPC Calculator.
Related Articles
- 25 Marketing KPIs & Metrics Every Marketer Should Track — Choose the right metrics.
- Content Marketing KPIs: 15 Metrics That Matter — Content dashboard metrics.
- Email Marketing Benchmarks 2026 — Email dashboard metrics.
- Marketing Funnel Explained: TOFU, MOFU, BOFU — Funnel metrics by stage.
FAQ
1. What is the best tool for building a marketing dashboard?
Google Looker Studio (formerly Data Studio) is the best starting point — it's free, connects to Google Analytics and Google Ads, and has a low learning curve. For more advanced needs, consider Tableau or Power BI.
2. How many metrics should be on a marketing dashboard?
5–8 metrics for an executive dashboard. 8–12 for a manager dashboard. More than that and you're not focusing — you're drowning in data.
3. How often should I update my marketing dashboard?
Executive dashboards: weekly. Manager dashboards: daily. Channel dashboards: real-time or hourly. Set alerts for critical metrics so you don't have to constantly check.
4. What's the difference between a dashboard and a report?
A dashboard is for real-time monitoring and quick decisions. A report is for deep analysis and strategic planning. You need both.
5. How do I get my team to actually use the dashboard?
Make it visible (display on a screen), make it actionable (include alerts), and make it part of your workflow (review in team meetings). If it's not part of the routine, it won't get used.
Related Calculators
- ROAS Calculator — Calculate return on ad spend
- CPA Calculator — Calculate cost per acquisition
- CPC Calculator — Calculate cost per click
- ROI & LTV Calculator — Factor in customer lifetime value