Key Takeaways:
- Lead scoring assigns numerical values to leads based on their behavior and fit — so sales focuses on the hottest prospects.
- Demographic scoring = who they are (title, company size, industry). Behavioral scoring = what they do (email opens, page visits, downloads).
- Lead scoring can reduce sales cycle length by 20–30% and increase conversion rates by 15–25%.
- Start simple: 5–10 criteria, point values of 1–5. Refine over time.
Your sales team has 500 leads. They call them in order. Half aren't interested. A quarter aren't decision-makers. The ones who are ready to buy? They called three weeks ago and nobody followed up.
Lead scoring fixes this. It ranks your leads by how likely they are to convert — so your sales team spends time on the right people at the right time.
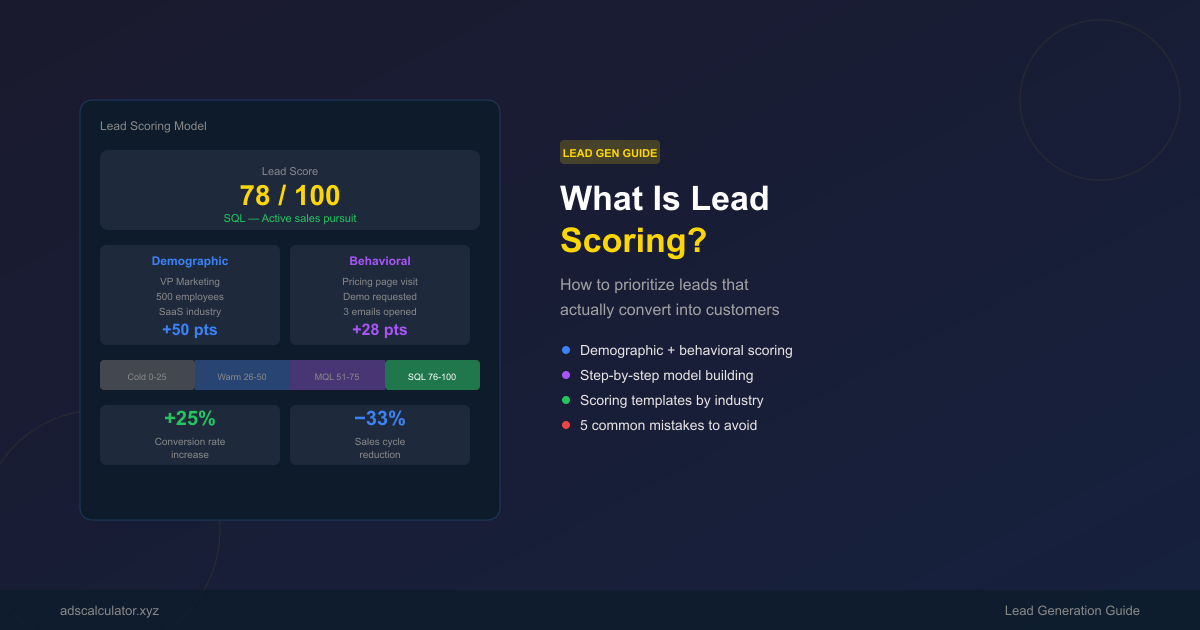
What Is Lead Scoring?
Lead scoring is a methodology that assigns numerical values (points) to each lead based on two factors:
- Demographic fit — Who are they? (Job title, company size, industry, location)
- Behavioral engagement — What do they do? (Email opens, page visits, downloads, demo requests)
The higher the score, the more likely the lead is to convert. Your sales team prioritizes high-score leads first.
Why Lead Scoring Matters
Without lead scoring, sales treats every lead the same. With lead scoring:
| Without Scoring | With Scoring |
|---|---|
| Sales calls leads in random order | Sales calls hottest leads first |
| 70% of calls go to unqualified leads | 70% of calls go to sales-ready leads |
| Sales cycle: 45 days | Sales cycle: 30 days (−33%) |
| Conversion rate: 2% | Conversion rate: 2.5% (+25%) |
| Sales wastes 60% of time | Sales focuses on high-value prospects |
Companies using lead scoring see 15–25% higher conversion rates and 20–30% shorter sales cycles because sales effort is concentrated on the right leads.
How Lead Scoring Works
The Basic Model
Each lead gets two scores:
Total Lead Score = Demographic Score + Behavioral Score
| Score Type | What It Measures | Example Criteria |
|---|---|---|
| Demographic | How well they fit your ideal customer profile | Title, company size, industry, budget |
| Behavioral | How engaged they are with your brand | Email opens, page visits, downloads, demo requests |
Lead Score Thresholds
| Score Range | Classification | Action |
|---|---|---|
| 0–25 | Cold lead | Nurture with content |
| 26–50 | Warm lead | Add to email sequence |
| 51–75 | Marketing Qualified Lead (MQL) | Pass to sales for qualification |
| 76–100 | Sales Qualified Lead (SQL) | Active sales pursuit |
Demographic Scoring: Who They Are
Demographic scoring evaluates how well a lead matches your Ideal Customer Profile (ICP).
Common Demographic Criteria
| Criteria | Points | Why |
|---|---|---|
| Job title (decision-maker) | +20 | They can say yes |
| Job title (influencer) | +10 | They influence the decision |
| Job title (end user) | +5 | They use the product but can't buy |
| Company size (matches ICP) | +15 | Right-sized company |
| Industry (target vertical) | +15 | You have proven results in their industry |
| Revenue (sufficient budget) | +10 | They can afford you |
| Location (target market) | +5 | You serve their region |
| Budget (confirmed) | +15 | They have money allocated |
Example: B2B SaaS ICP Scoring
| Lead | Title | Company | Industry | Revenue | Demographic Score |
|---|---|---|---|---|---|
| Lead A | VP Marketing | 500 employees | SaaS | $50M | 75/80 |
| Lead B | Marketing Manager | 50 employees | Retail | $5M | 35/80 |
| Lead C | CEO | 200 employees | SaaS | $20M | 65/80 |
Lead A is a perfect fit. Lead B is too small and wrong industry. Lead C is a strong fit but may not have budget authority for a large purchase.
Behavioral Scoring: What They Do
Behavioral scoring tracks actions that indicate buying intent.
Common Behavioral Criteria
| Action | Points | Why |
|---|---|---|
| Visited pricing page | +15 | Strong purchase intent |
| Requested a demo | +20 | Ready to evaluate |
| Downloaded a case study | +10 | Researching solutions |
| Opened 3+ emails in a row | +10 | Engaged with your content |
| Visited blog 5+ times | +5 | Building awareness |
| Attended a webinar | +10 | Deep engagement |
| Clicked CTA in email | +5 | Interested in offer |
| Visited "About Us" page | +5 | Evaluating your company |
| Unsubscribed from email | −15 | Lost interest |
| No activity in 30 days | −10 | Going cold |
Behavioral Scoring by Funnel Stage
| Funnel Stage | Typical Behaviors | Points |
|---|---|---|
| TOFU (Awareness) | Blog visits, social follows, first email open | +1 to +5 per action |
| MOFU (Consideration) | Case study downloads, webinar attendance, multiple page visits | +5 to +15 per action |
| BOFU (Decision) | Pricing page visits, demo requests, comparison page views | +15 to +25 per action |
Key insight: A lead that visits your pricing page (+15) and downloads a case study (+10) and opens 5 emails in a row (+10) is far more valuable than a lead that only reads blog posts (+5).
Building Your Lead Scoring Model: Step by Step
Step 1: Define Your Ideal Customer Profile (ICP)
Work with sales to answer:
- What job titles buy from us?
- What company sizes do we serve best?
- What industries have the highest close rates?
- What's the minimum budget required?
Step 2: Assign Demographic Points
Create a scoring matrix based on your ICP:
| Criteria | Best Fit | Partial Fit | Poor Fit |
|---|---|---|---|
| Title | Decision-maker (+20) | Influencer (+10) | End user (+5) |
| Company size | 100–1,000 employees (+15) | 50–100 or 1,000–5,000 (+5) | <50 or >5,000 (0) |
| Industry | Target vertical (+15) | Adjacent industry (+5) | Non-target (0) |
| Revenue | >$10M (+10) | $1M–$10M (+5) | <$1M (0) |
Step 3: Assign Behavioral Points
Track actions that correlate with conversions:
| Action | Points | Funnel Stage |
|---|---|---|
| Pricing page visit | +15 | BOFU |
| Demo request | +25 | BOFU |
| Case study download | +10 | MOFU |
| Webinar attendance | +10 | MOFU |
| Email click (CTA) | +5 | MOFU |
| Blog visit | +2 | TOFU |
| Email open | +1 | TOFU |
| Unsubscribe | −15 | — |
| 30 days inactive | −10 | — |
Step 4: Set Score Thresholds
Define what each score range means:
| Score | Classification | Action |
|---|---|---|
| 0–25 | Cold | Automated nurture |
| 26–50 | Warm | Targeted email sequences |
| 51–75 | MQL | Sales qualification call |
| 76–100 | SQL | Active sales pursuit |
Step 5: Implement in Your CRM
Most CRMs support lead scoring natively:
| CRM | Lead Scoring Feature |
|---|---|
| HubSpot | Predictive lead scoring (paid), custom scoring (free) |
| Salesforce | Einstein Lead Scoring (paid), custom scoring rules |
| Pipedrive | Custom scoring via workflows |
| ActiveCampaign | Built-in lead scoring |
| Zoho CRM | Custom scoring rules |
Step 6: Review and Refine
Lead scoring isn't "set and forget." Review monthly:
- Are high-score leads actually converting?
- Are we missing important behaviors?
- Do thresholds need adjusting?
Lead Scoring Models
Model 1: Simple Point-Based Scoring
Assign fixed points to each criterion. Sum for total score.
Pros: Easy to set up, easy to understand
Cons: Doesn't account for recency or combinations of behaviors
Model 2: Recency-Weighted Scoring
Recent actions count more than old ones:
| Action | Points | Decay |
|---|---|---|
| Pricing page visit (today) | +15 | −1 point/day |
| Pricing page visit (30 days ago) | +0 | Fully decayed |
| Email open (today) | +3 | −0.5/day |
| Email open (30 days ago) | +0 | Fully decayed |
Pros: Reflects current intent, not historical interest
Cons: More complex to implement
Model 3: Predictive Lead Scoring (AI)
Machine learning models analyze historical data to predict which leads are most likely to convert.
Pros: Most accurate, learns from your data
Cons: Requires large data sets, expensive (HubSpot Predictive, Salesforce Einstein)
Recommendation: Start with Model 1 (simple). Move to Model 2 (recency) when you have enough data. Consider Model 3 (predictive) when you have 1,000+ closed deals.
Lead Scoring Best Practices
1. Start Simple
Don't try to build a perfect model on day one. Start with 5–10 criteria and refine over time.
2. Align Sales and Marketing
Lead scoring only works if both teams agree on:
- What makes a lead "qualified"
- What score triggers a sales handoff
- What happens after the handoff
3. Include Negative Scoring
Not all engagement is positive. Subtract points for:
- Unsubscribing from email (−15)
- No activity in 30+ days (−10)
- Being a student or competitor (−20)
- Using a free email domain for B2B (−5)
4. Track Score-to-Conversion Correlation
After 3–6 months, analyze: Do high-score leads actually convert at higher rates? If not, adjust your scoring criteria.
5. Don't Forget Lead Routing
Scoring is useless if the right sales rep doesn't get the lead. Set up routing rules:
- Enterprise leads → Enterprise sales team
- SMB leads → Inside sales team
- Specific industries → Industry specialists
Lead Scoring by Industry
B2B SaaS
| Criteria | Points |
|---|---|
| VP/C-level title | +20 |
| Company size 100–1,000 | +15 |
| Visited pricing page | +15 |
| Requested demo | +25 |
| Downloaded case study | +10 |
| Attended webinar | +10 |
| MQL threshold | 60 |
| SQL threshold | 80 |
E-commerce
| Criteria | Points |
|---|---|
| Added to cart | +10 |
| Viewed 3+ products | +5 |
| Returned 3+ times | +15 |
| Viewed shipping info | +10 |
| Abandoned cart | +15 |
| High-intent threshold | 40 |
Lead Generation (Agency/Consulting)
| Criteria | Points |
|---|---|
| Decision-maker title | +20 |
| Company revenue >$10M | +15 |
| Downloaded proposal template | +15 |
| Requested consultation | +25 |
| Referred by existing client | +20 |
| MQL threshold | 50 |
| SQL threshold | 70 |
Common Lead Scoring Mistakes
1. Scoring Too Many Criteria
If you have 50 scoring criteria, you'll never understand what's driving results. Start with 5–10 and add more only when you have evidence they matter.
2. Not Including Negative Scoring
A lead that visited your pricing page 3 months ago but hasn't opened an email since isn't hot. Decay and negative scoring prevent false positives.
3. Setting Thresholds Arbitrarily
Your MQL threshold should be based on data, not gut feeling. Analyze which score ranges actually convert and set thresholds accordingly.
4. Not Reviewing Regularly
Your ICP changes. Your market changes. Your scoring model should change too. Review quarterly.
5. Scoring Without Sales Alignment
If sales doesn't trust the scores, they'll ignore them. Involve sales in building the model and reviewing results.
Conclusion
Lead scoring turns your lead list from a phone book into a prioritized action list. It ensures your sales team spends time on the leads most likely to convert — and stops wasting time on leads who aren't ready.
Start simple. Define your ICP. Assign points to 5–10 demographic and behavioral criteria. Set thresholds. Implement in your CRM. Review and refine monthly.
The best lead scoring model is the one your sales team actually trusts and uses.
Measure your lead performance with our CPA Calculator, Conversion Rate Guide, and Funnel Guide.
Related Articles
- Marketing Funnel Explained: TOFU, MOFU, BOFU — Understand the funnel stages.
- Content Marketing KPIs: 15 Metrics That Matter — Measure content-driven lead generation.
- What Is a Good Conversion Rate? Benchmarks by Industry — Conversion benchmarks by sector.
- 30 Marketing Abbreviations & Acronyms — MQL, SQL, and more defined.
FAQ
1. What is lead scoring?
Lead scoring assigns numerical values to leads based on their demographic fit and behavioral engagement. Higher scores indicate higher likelihood to convert.
2. What is a good lead score threshold for MQL?
It varies by business, but a common starting point is 50–60 points out of 100. Analyze your historical data to find the score range that best predicts conversion.
3. How many criteria should I use for lead scoring?
Start with 5–10 criteria. More than 15 and the model becomes hard to manage and interpret. Add criteria only when you have evidence they improve prediction accuracy.
4. Should I use predictive lead scoring?
Predictive scoring (AI-based) is most effective when you have 1,000+ closed deals to train on. For smaller datasets, simple point-based scoring works well and is easier to manage.
5. How often should I review my lead scoring model?
Monthly for the first 6 months, then quarterly. Review score-to-conversion correlation, adjust point values, and update thresholds based on actual results.
Related Calculators
- CPA Calculator — Calculate cost per acquisition
- ROAS Calculator — Calculate return on ad spend
- CPC Calculator — Calculate cost per click
- ROI & LTV Calculator — Factor in customer lifetime value